Fig. 19
Download original image
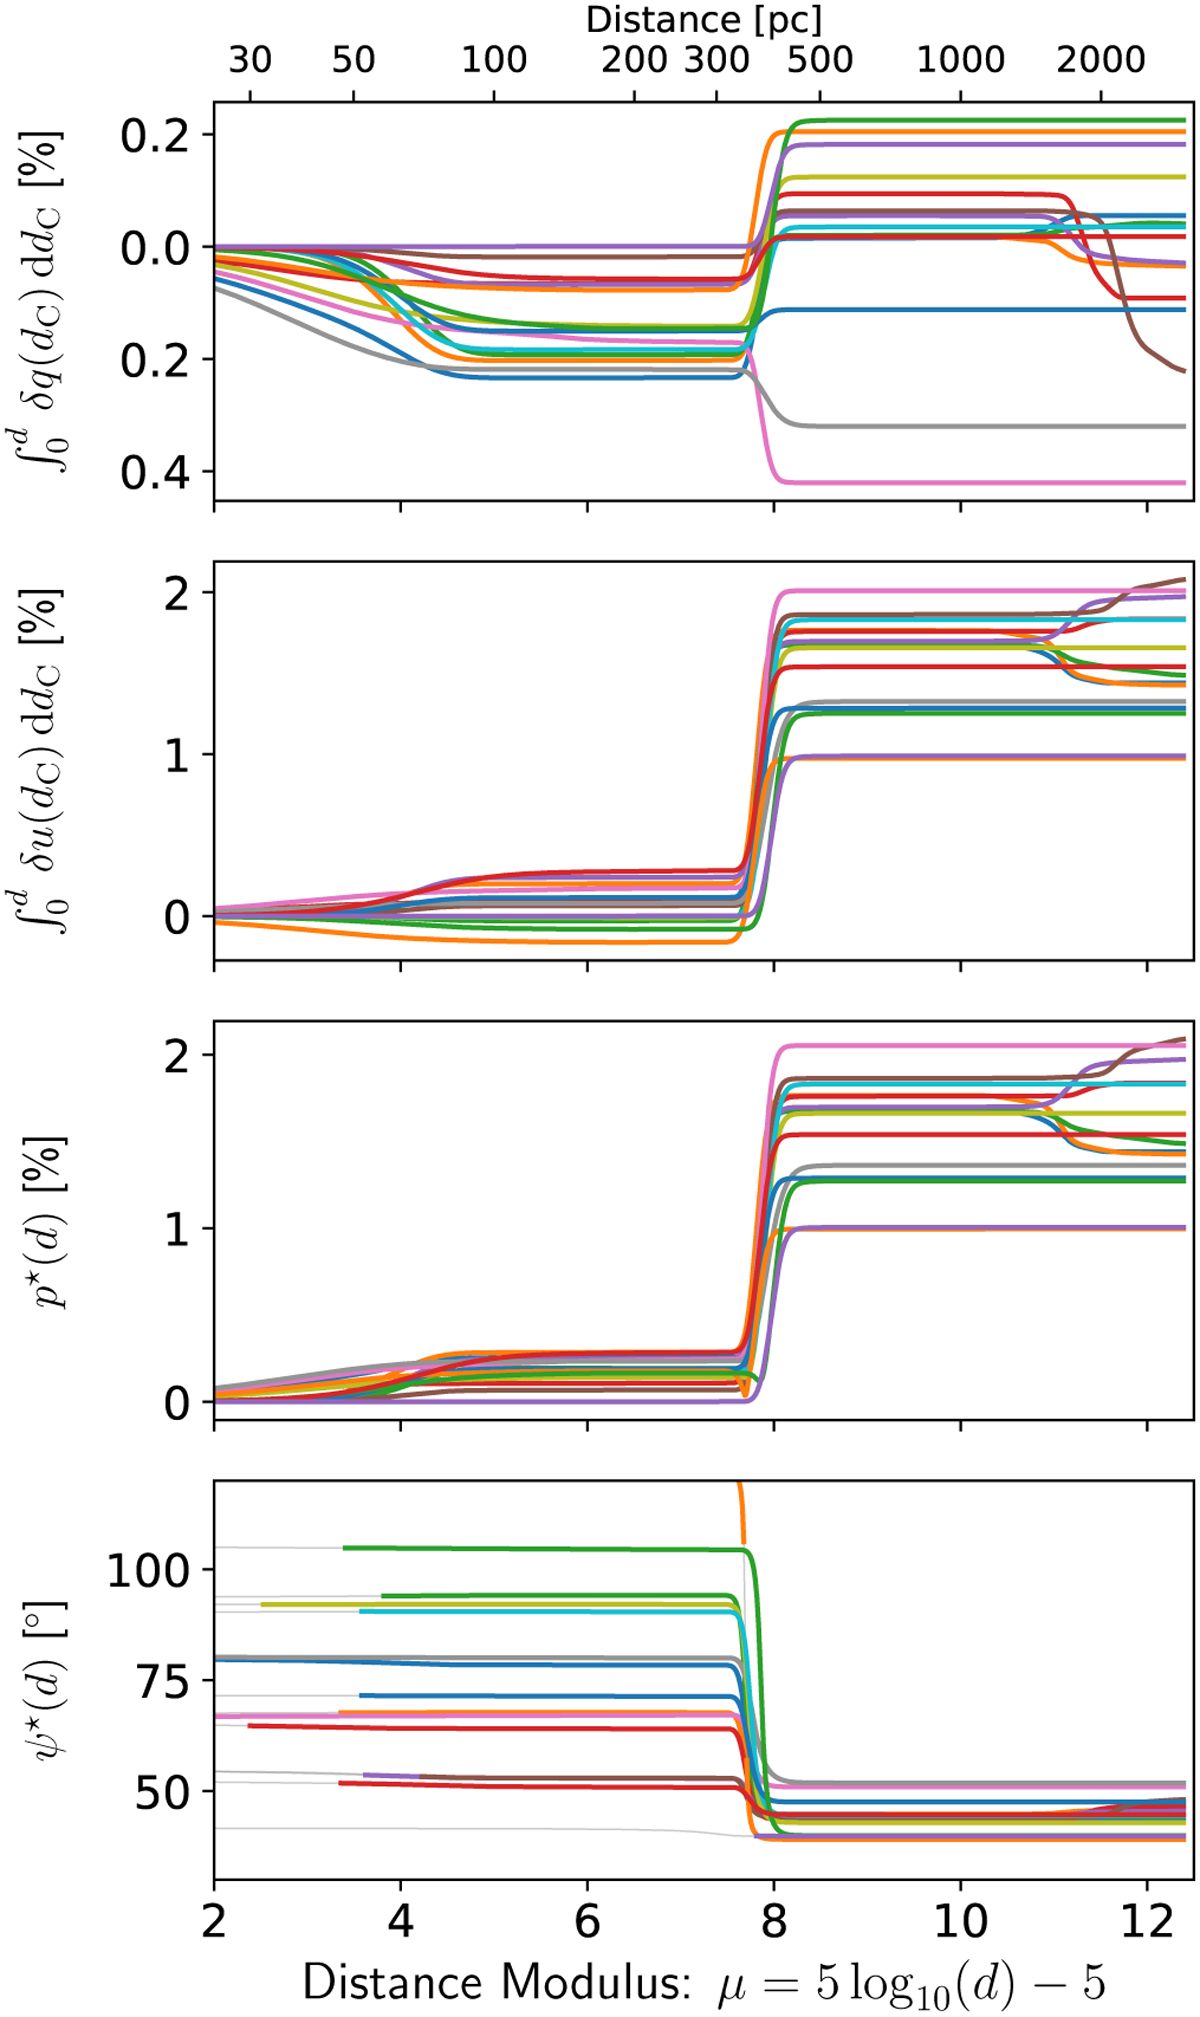
Polarization of a test star as a function of its distance for the same set of sightlines as shown in Fig. 18. The first and second rows show the cumulatives of the radial profiles of the differentials δq and δu as a function of distance. The third and fourth rows show the degree of polarization and polarization angle observed for the test star, as derived from the cumulatives of derived δq and δu. For p★ < 0.05%, ψ★ is masked (shown by thin gray line).
Current usage metrics show cumulative count of Article Views (full-text article views including HTML views, PDF and ePub downloads, according to the available data) and Abstracts Views on Vision4Press platform.
Data correspond to usage on the plateform after 2015. The current usage metrics is available 48-96 hours after online publication and is updated daily on week days.
Initial download of the metrics may take a while.