Open Access
Fig. 17
Download original image
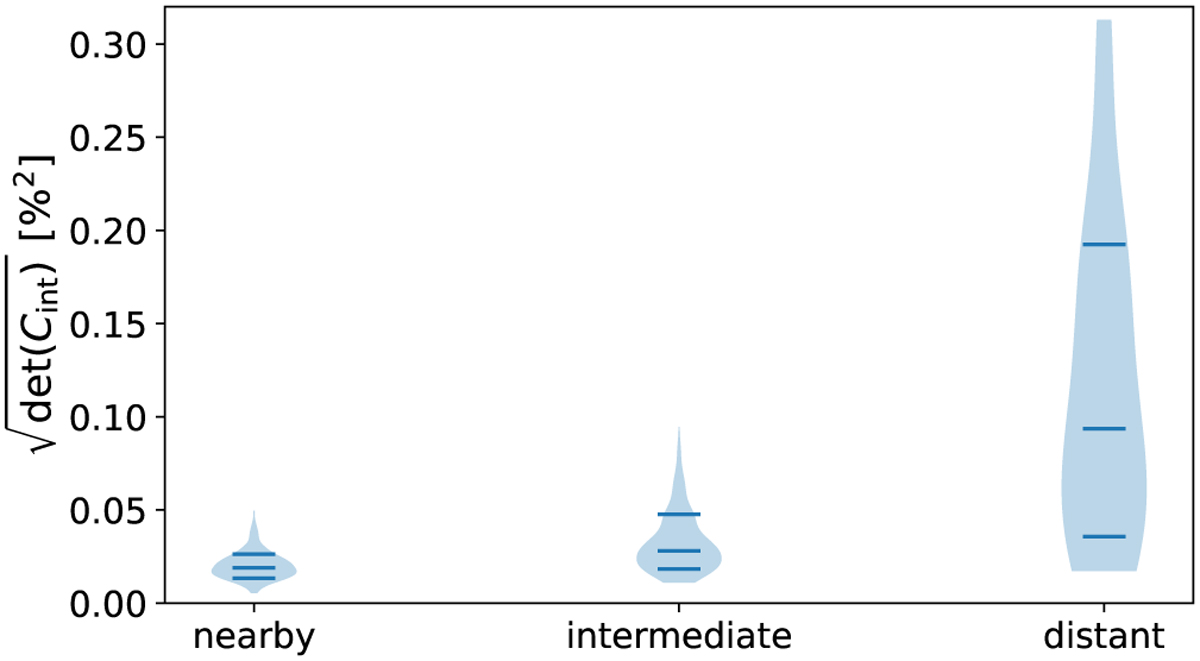
Violin diagrams of the distributions of the square root of ![]() obtained from the posterior distributions and for the three distance ranges defined from Fig. 14. In each diagram, the horizontal segments indicate the 16th, 50th and 84th percentiles of the distribution.
obtained from the posterior distributions and for the three distance ranges defined from Fig. 14. In each diagram, the horizontal segments indicate the 16th, 50th and 84th percentiles of the distribution.
Current usage metrics show cumulative count of Article Views (full-text article views including HTML views, PDF and ePub downloads, according to the available data) and Abstracts Views on Vision4Press platform.
Data correspond to usage on the plateform after 2015. The current usage metrics is available 48-96 hours after online publication and is updated daily on week days.
Initial download of the metrics may take a while.