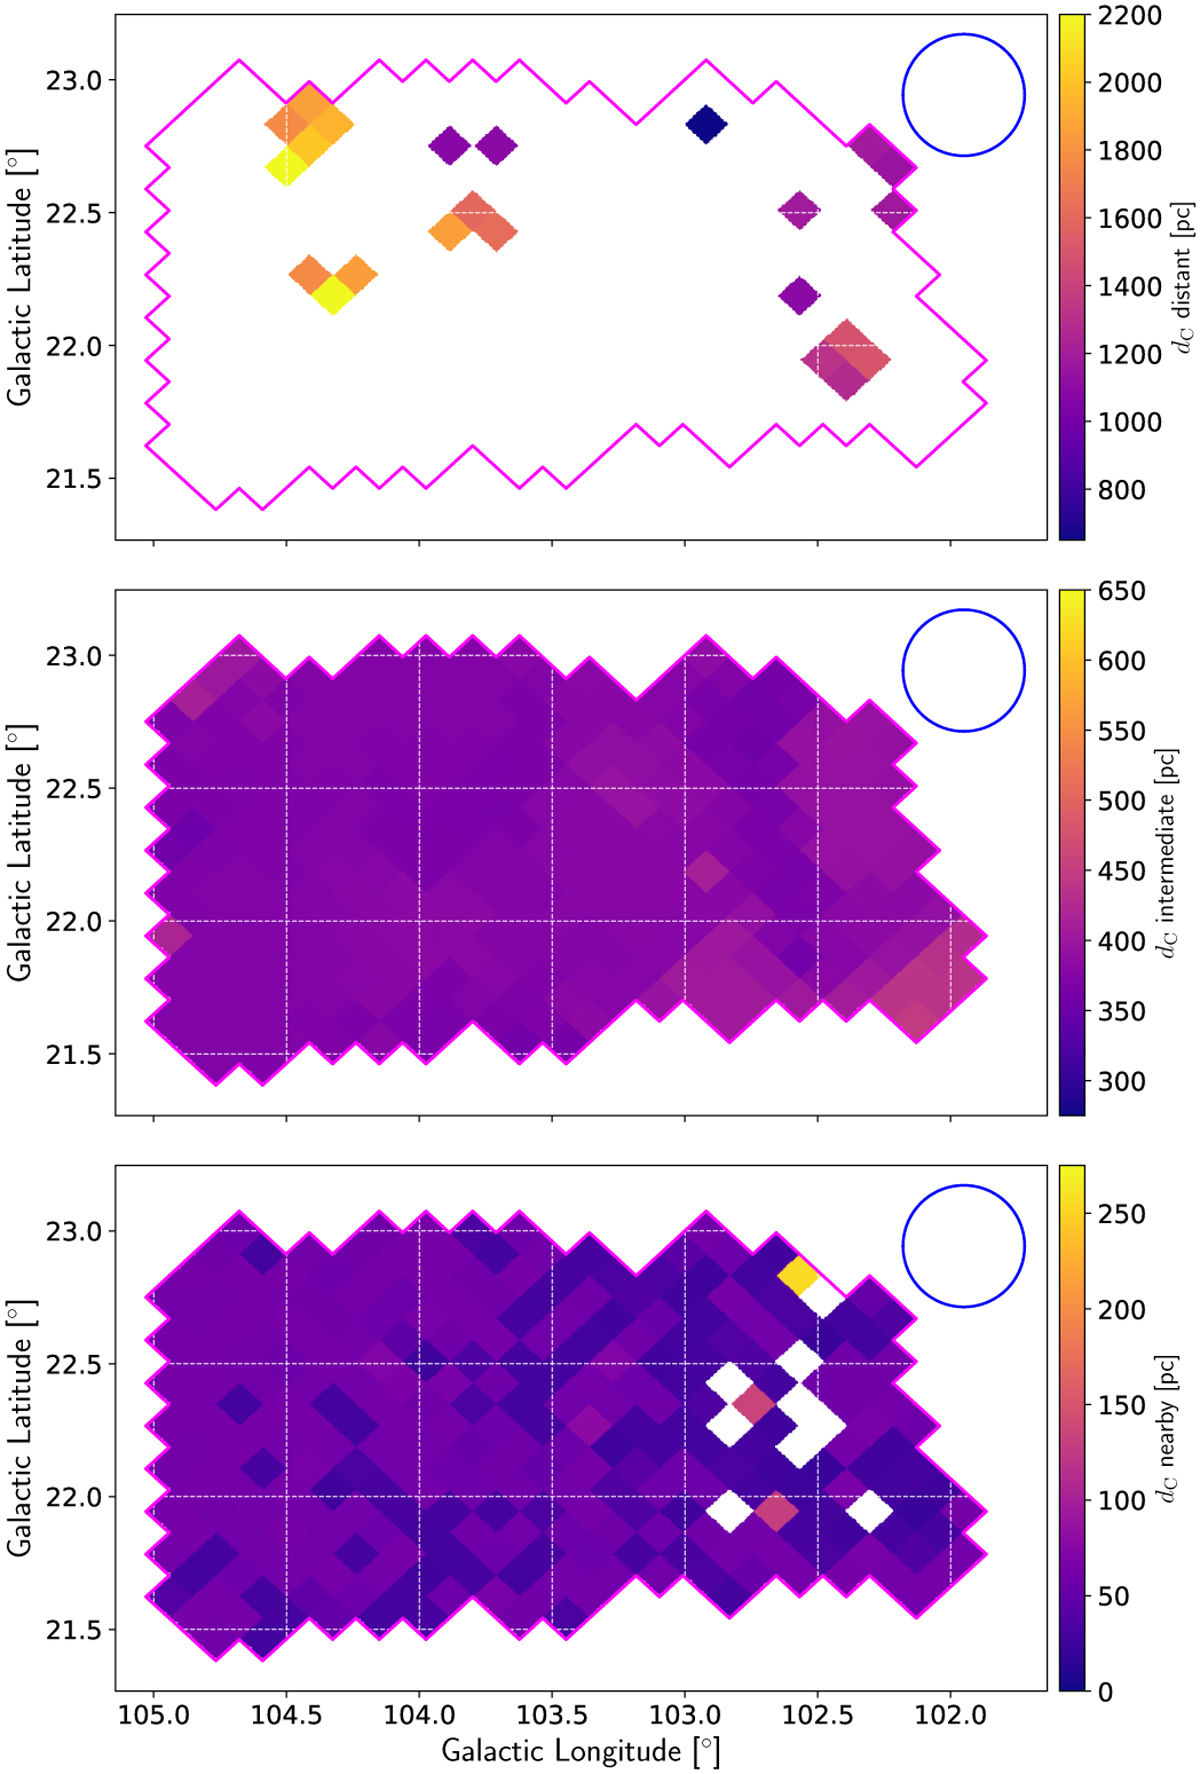
Fig. 15
Download original image
Maps of the estimated mean cloud distances in the three bins of distances identified from Fig. 14, from far away (top) to nearby (bottom). The color scales span the full range of distance in each bin. Empty pixels of the observed regions mark the absence of clouds in the specific distance range. The magenta contour and the blue circle are as in Fig. 10.
Current usage metrics show cumulative count of Article Views (full-text article views including HTML views, PDF and ePub downloads, according to the available data) and Abstracts Views on Vision4Press platform.
Data correspond to usage on the plateform after 2015. The current usage metrics is available 48-96 hours after online publication and is updated daily on week days.
Initial download of the metrics may take a while.