Open Access
Fig. 14
Download original image
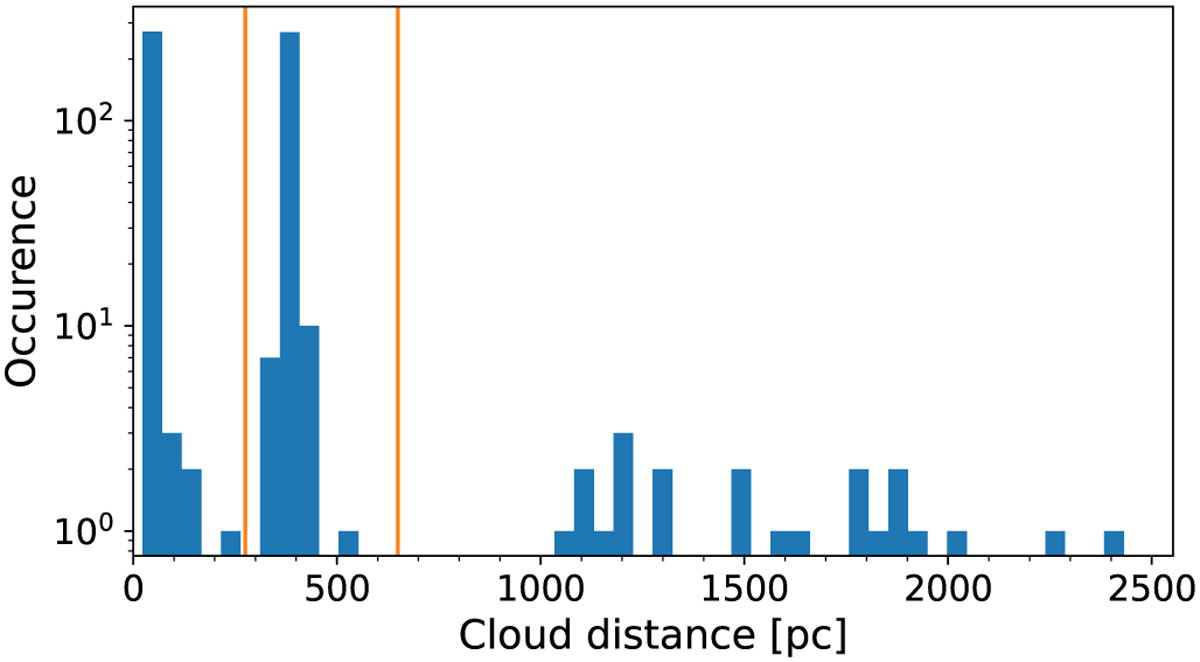
Histogram of estimated mean cloud distances ![]() . Distribution of mean posterior cloud distances
. Distribution of mean posterior cloud distances ![]() for the best fit models determined for all sightlines. The vertical lines indicate the limits to define the distance bins used in Sect. 4.1.
for the best fit models determined for all sightlines. The vertical lines indicate the limits to define the distance bins used in Sect. 4.1.
Current usage metrics show cumulative count of Article Views (full-text article views including HTML views, PDF and ePub downloads, according to the available data) and Abstracts Views on Vision4Press platform.
Data correspond to usage on the plateform after 2015. The current usage metrics is available 48-96 hours after online publication and is updated daily on week days.
Initial download of the metrics may take a while.