Fig. 13
Download original image
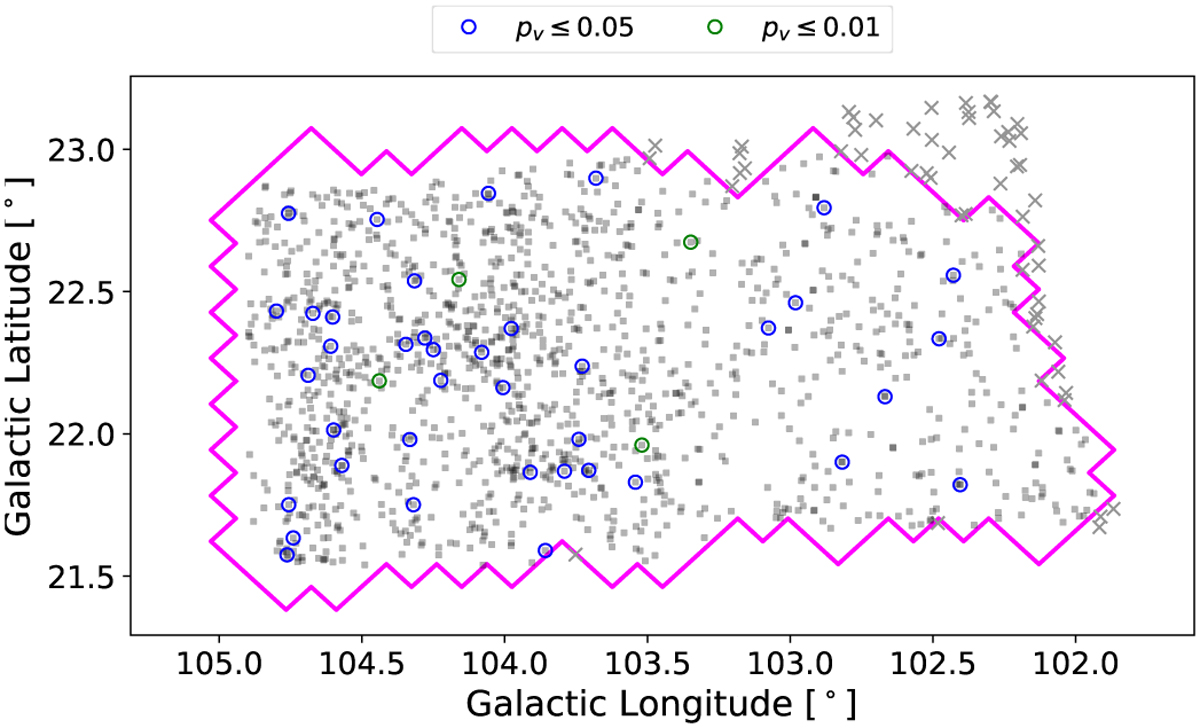
Sky map of residual significance. All the stars in the sample from which we performed our tomographic inversion are represented. Transparent gray dots (gray crosses) show stars that do (do not) fall in an HEALPix pixel for which we have tomography data. Blue and green circles show the stars for which the median of their distribution of Mahalanobis distances exceed a threshold values corresponding to the p-value indicated in the legend (see text). The lower the p-value, the more significant the residuals.
Current usage metrics show cumulative count of Article Views (full-text article views including HTML views, PDF and ePub downloads, according to the available data) and Abstracts Views on Vision4Press platform.
Data correspond to usage on the plateform after 2015. The current usage metrics is available 48-96 hours after online publication and is updated daily on week days.
Initial download of the metrics may take a while.