Open Access
Fig. 12
Download original image
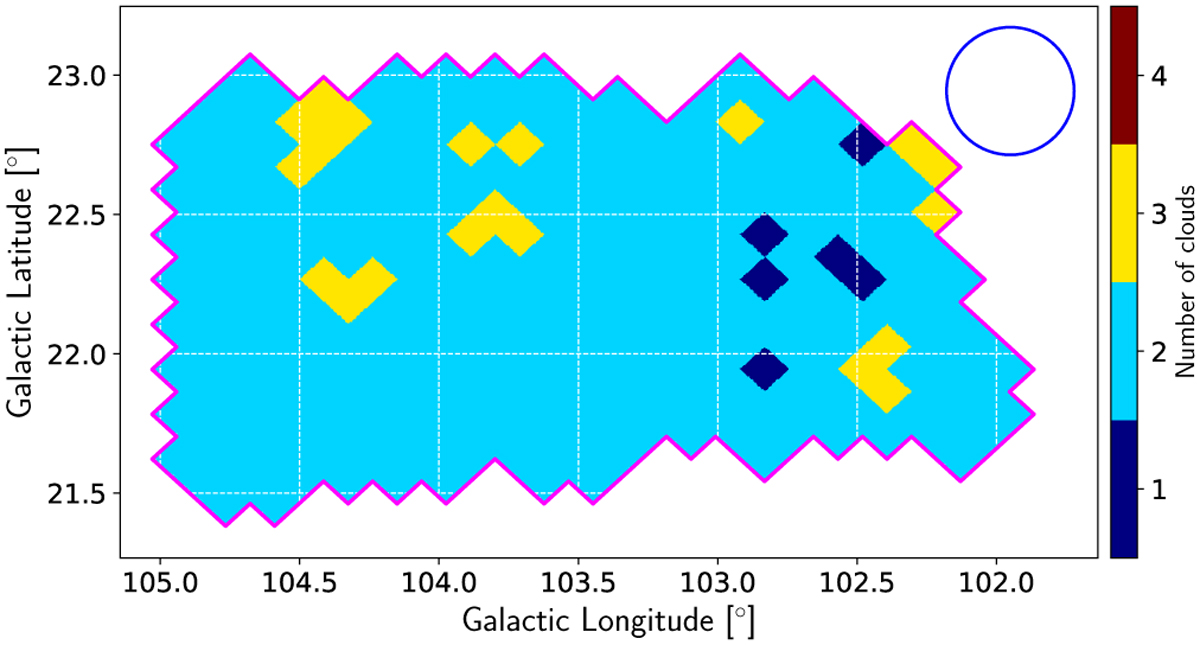
Map of the number of dust clouds along the sightlines identified at the end of Step 2 in the conical beam centered on the pixel centers. The blue circle in the top-right corner indicates the extent of the conical beam.
Current usage metrics show cumulative count of Article Views (full-text article views including HTML views, PDF and ePub downloads, according to the available data) and Abstracts Views on Vision4Press platform.
Data correspond to usage on the plateform after 2015. The current usage metrics is available 48-96 hours after online publication and is updated daily on week days.
Initial download of the metrics may take a while.