Fig. 1
Download original image
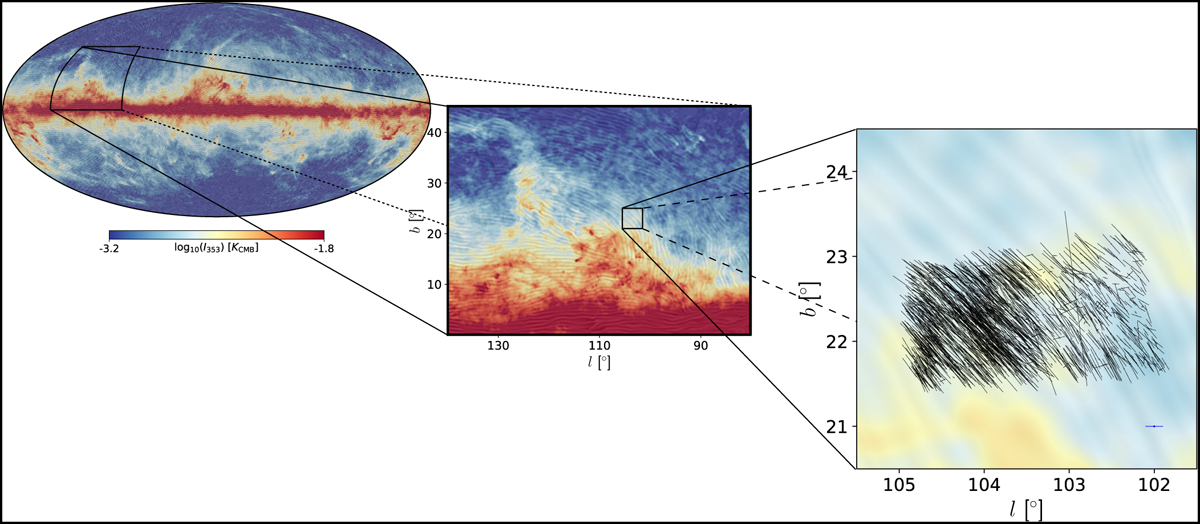
Sky location of the surveyed area of about four square degrees. Left: full-sky map of the dust emission as seen by Planck at 353 GHz (Planck Collaboration XII 2020). The color represents the intensity of dust emission on logarithmic scale. The line-integral-convolution texture shows the polarization angle of the dust emission rotated by 90°. Middle: a zoom-in of the map toward the surveyed regions, which includes part of the North Celestial Pole Loop on the East of the map. Right: a closer view of the surveyed region. Black segments indicate the polarization orientation from the stars in our survey and from Panopoulou et al. (2019). The segments are scaled according to the polarization fraction. Unpolarized stars appear as dots. The blue, horizontal segment in the bottom right corner shows the scale for a 1% polarized star. Outlier candidates (see Sect. 3.3) are not shown.
Current usage metrics show cumulative count of Article Views (full-text article views including HTML views, PDF and ePub downloads, according to the available data) and Abstracts Views on Vision4Press platform.
Data correspond to usage on the plateform after 2015. The current usage metrics is available 48-96 hours after online publication and is updated daily on week days.
Initial download of the metrics may take a while.