Fig. 5
Download original image
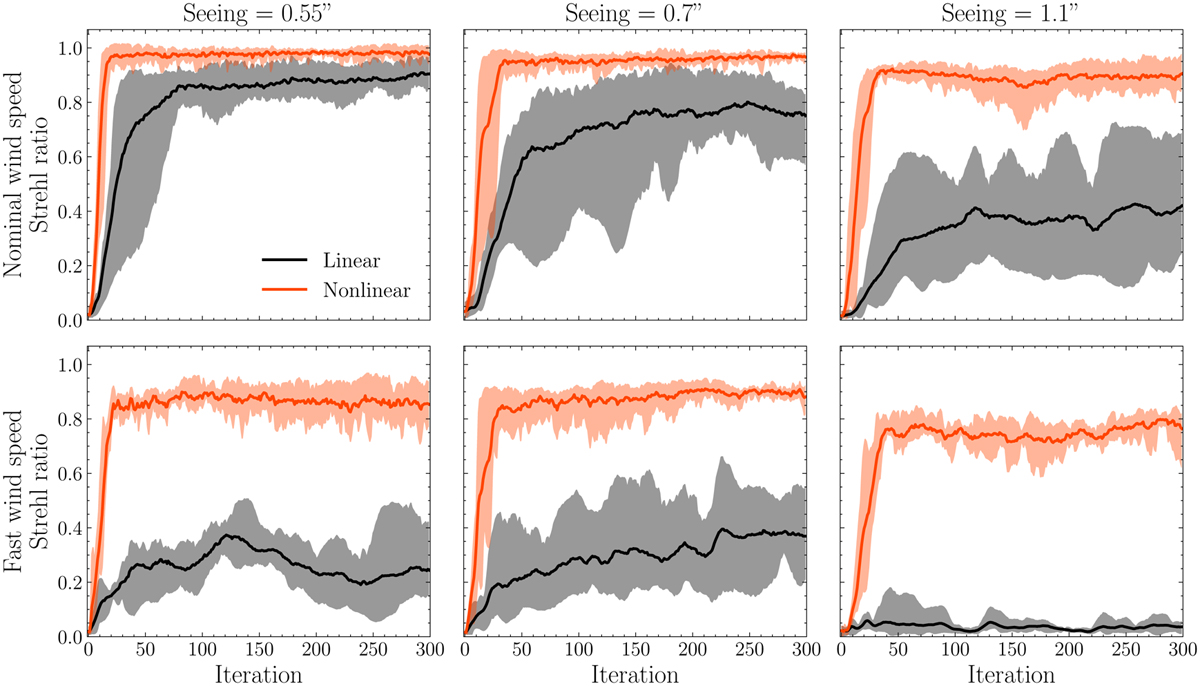
Closed-loop performance of the linear and nonlinear reconstructor for different atmospheric conditions. The solid line shows the mean Strehl at 875 nm over the five experiments, while the filled region indicates the minimum and maximum Strehl over the experiments. The top row shows the performance for a wind speed corresponding to median conditions at LCO with a ![]() -weighted value of 18 m s−1, while the bottom row uses double that value. The different columns correspond to different values for the seeing of the simulated turbulence. Videos of the closed-loop tests are available at online.
-weighted value of 18 m s−1, while the bottom row uses double that value. The different columns correspond to different values for the seeing of the simulated turbulence. Videos of the closed-loop tests are available at online.
Current usage metrics show cumulative count of Article Views (full-text article views including HTML views, PDF and ePub downloads, according to the available data) and Abstracts Views on Vision4Press platform.
Data correspond to usage on the plateform after 2015. The current usage metrics is available 48-96 hours after online publication and is updated daily on week days.
Initial download of the metrics may take a while.