Fig. 2
Download original image
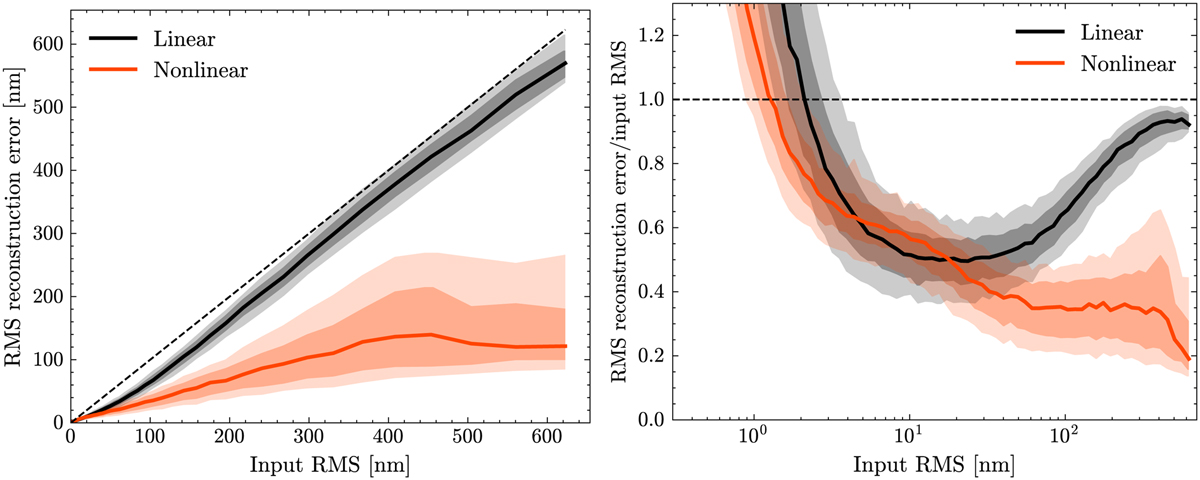
Comparison of the reconstruction accuracy of the nonlinear CNN with a linear model on the test dataset. The solid line indicates the mean value, and the colored region shows the 68% and 95% confidence intervals. The dotted line indicates where the RMS error of the reconstruction is equal to the input RMS, i.e., where there is no improvement. Left: residual RMS error of the prediction as a function of the RMS of the input wavefront, shown on a linear scale. Right: improvement factor, defined as the ratio between the residual RMS and the input RMS, as a function of the input RMS, which is shown on a logarithmic scale.
Current usage metrics show cumulative count of Article Views (full-text article views including HTML views, PDF and ePub downloads, according to the available data) and Abstracts Views on Vision4Press platform.
Data correspond to usage on the plateform after 2015. The current usage metrics is available 48-96 hours after online publication and is updated daily on week days.
Initial download of the metrics may take a while.