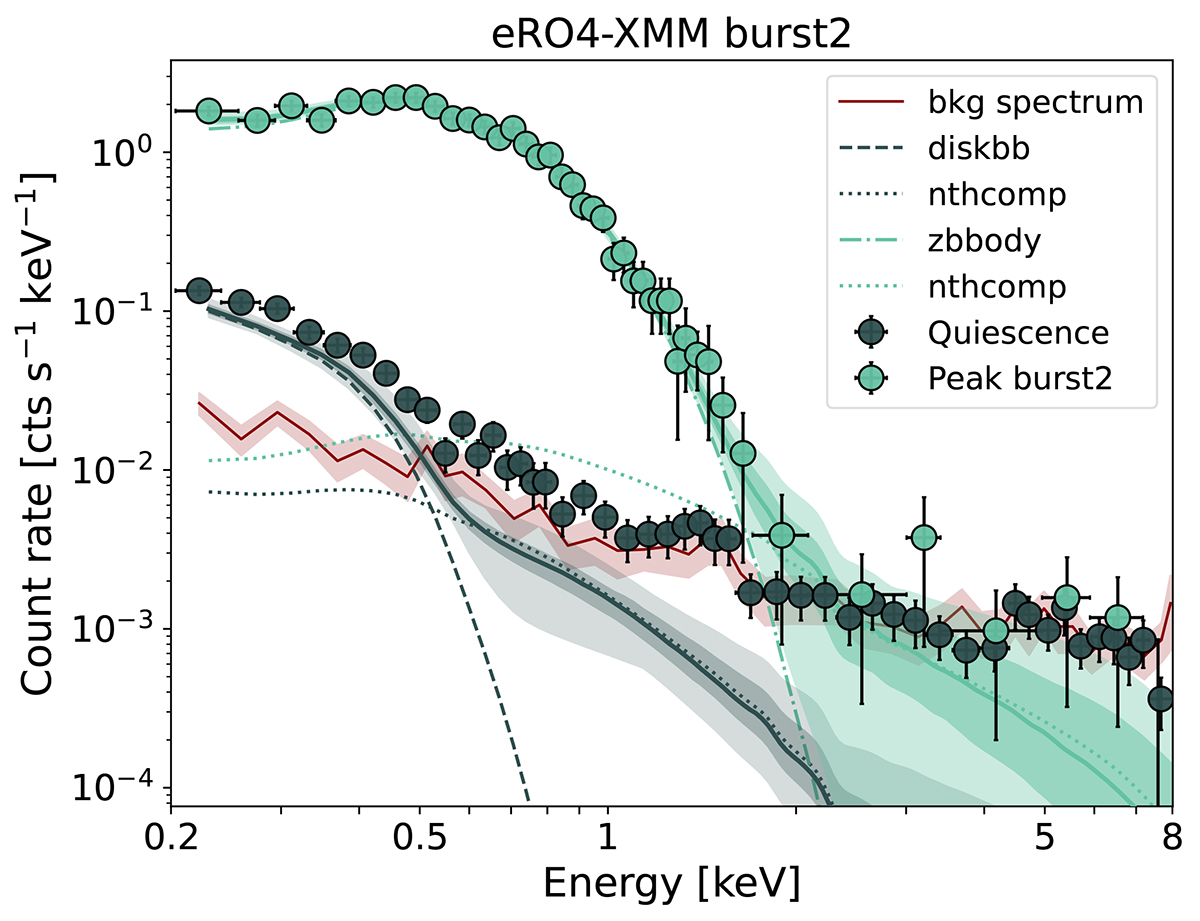
Fig. 7.
Download original image
Spectrum of eRO-QPE4 in quiescence (dark gray) and at the peak of the second burst in the observation eRO4-XMM (light green, following the color-coding of Fig. A.9). The dark-red line and contour represent the background spectrum and its uncertainties. Source plus background data points are shown to put the source-only models (lines and contours with the same colors) into context. Darker model contours are 1σ percentiles, lighter ones are 3σ. Individual model components are labeled.
Current usage metrics show cumulative count of Article Views (full-text article views including HTML views, PDF and ePub downloads, according to the available data) and Abstracts Views on Vision4Press platform.
Data correspond to usage on the plateform after 2015. The current usage metrics is available 48-96 hours after online publication and is updated daily on week days.
Initial download of the metrics may take a while.