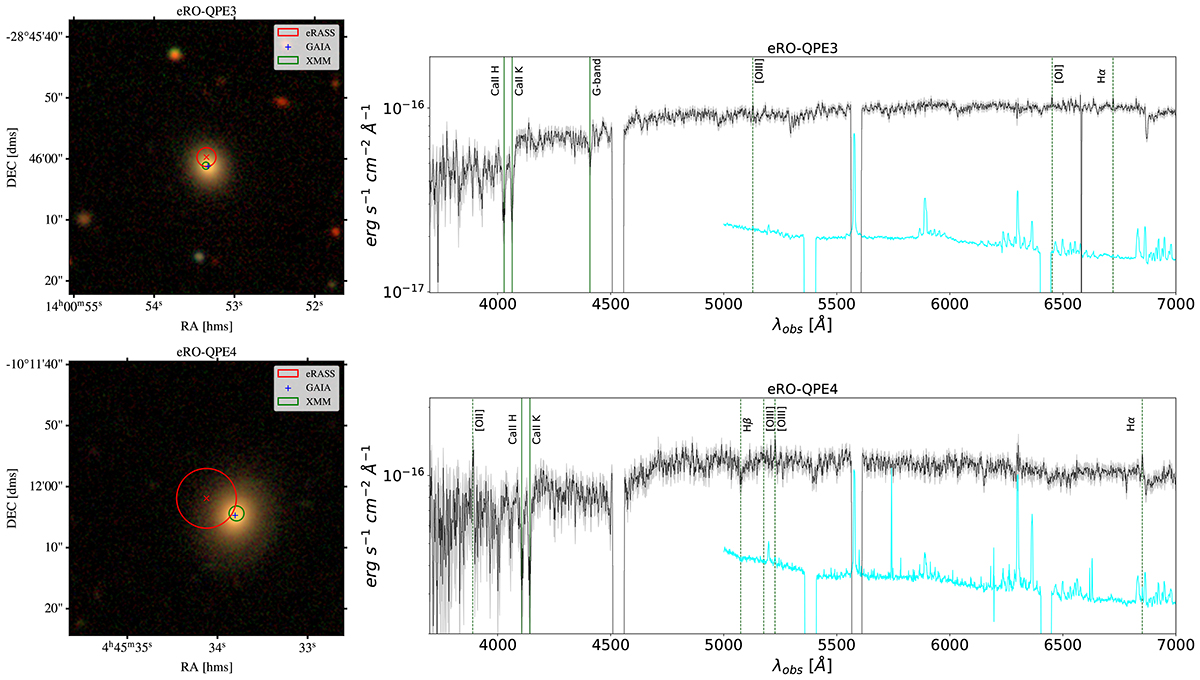
Fig. 3.
Download original image
Left panels: 45″ × 45″ cutout of the DESI Legacy Imaging Surveys Data Release 10 (Legacy Surveys/D. Lang (Perimeter Institute)) with the X-ray 1σ position circles in red (eROSITA) and green (XMM-Newton), for eRO-QPE3 (top) and eRO-QPE4 (bottom). Right panels: SALT optical spectra of eRO-QPE3 (top) and eRO-QPE4 (bottom), with inferred spec-z of ∼0.024 and ∼0.044, respectively. The sky spectrum of the red spectral exposure is shown in cyan in arbitrary units in both subpanels.
Current usage metrics show cumulative count of Article Views (full-text article views including HTML views, PDF and ePub downloads, according to the available data) and Abstracts Views on Vision4Press platform.
Data correspond to usage on the plateform after 2015. The current usage metrics is available 48-96 hours after online publication and is updated daily on week days.
Initial download of the metrics may take a while.