Fig. A.10.
Download original image
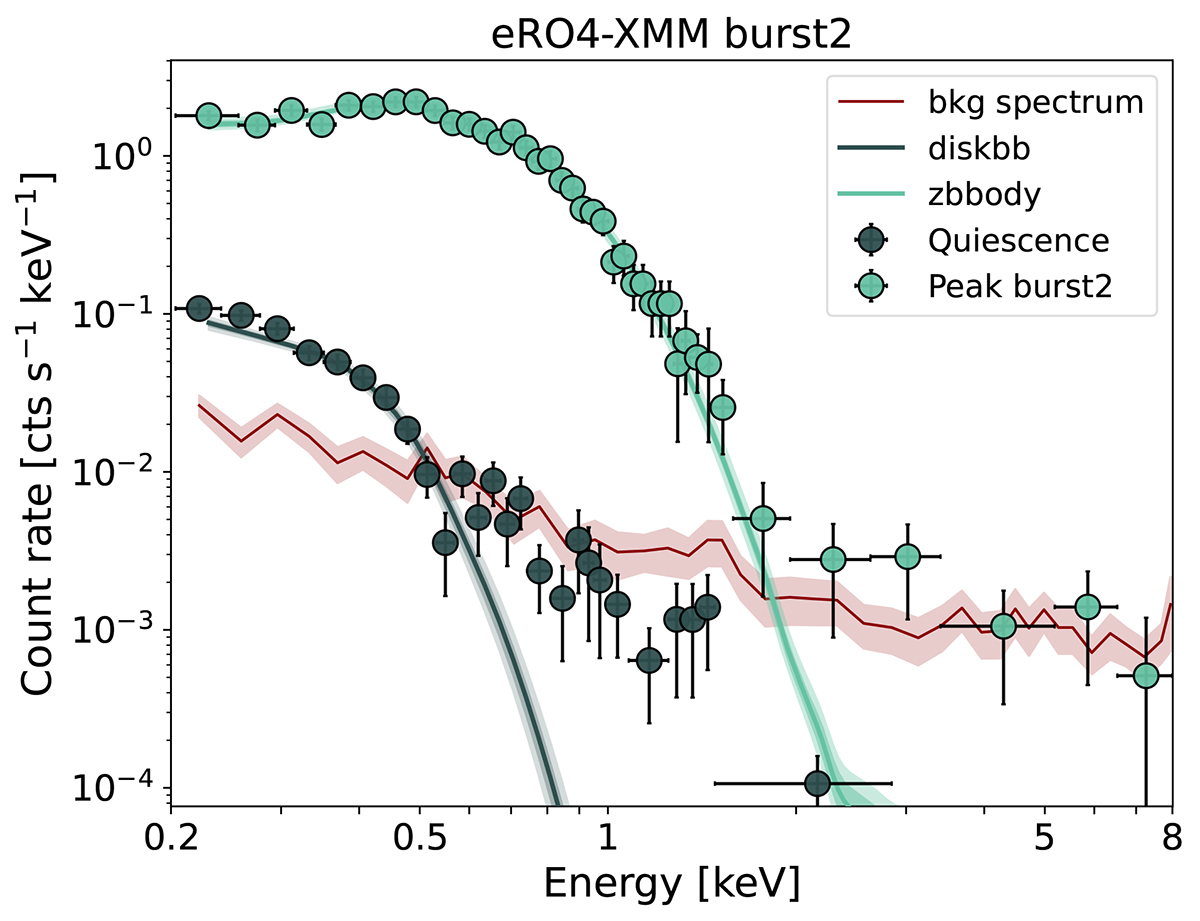
Same as Fig. 7, but showing background-subtracted spectra. The models shown are a simple disk spectrum for quiescence and a black body in addition for the peak, both showing significant residuals at higher energies. These residuals are comparable with background or even brighter. The background spectrum (subtracted to yield the data shown) is represented in in red for visualization.
Current usage metrics show cumulative count of Article Views (full-text article views including HTML views, PDF and ePub downloads, according to the available data) and Abstracts Views on Vision4Press platform.
Data correspond to usage on the plateform after 2015. The current usage metrics is available 48-96 hours after online publication and is updated daily on week days.
Initial download of the metrics may take a while.