Fig. A.1.
Download original image
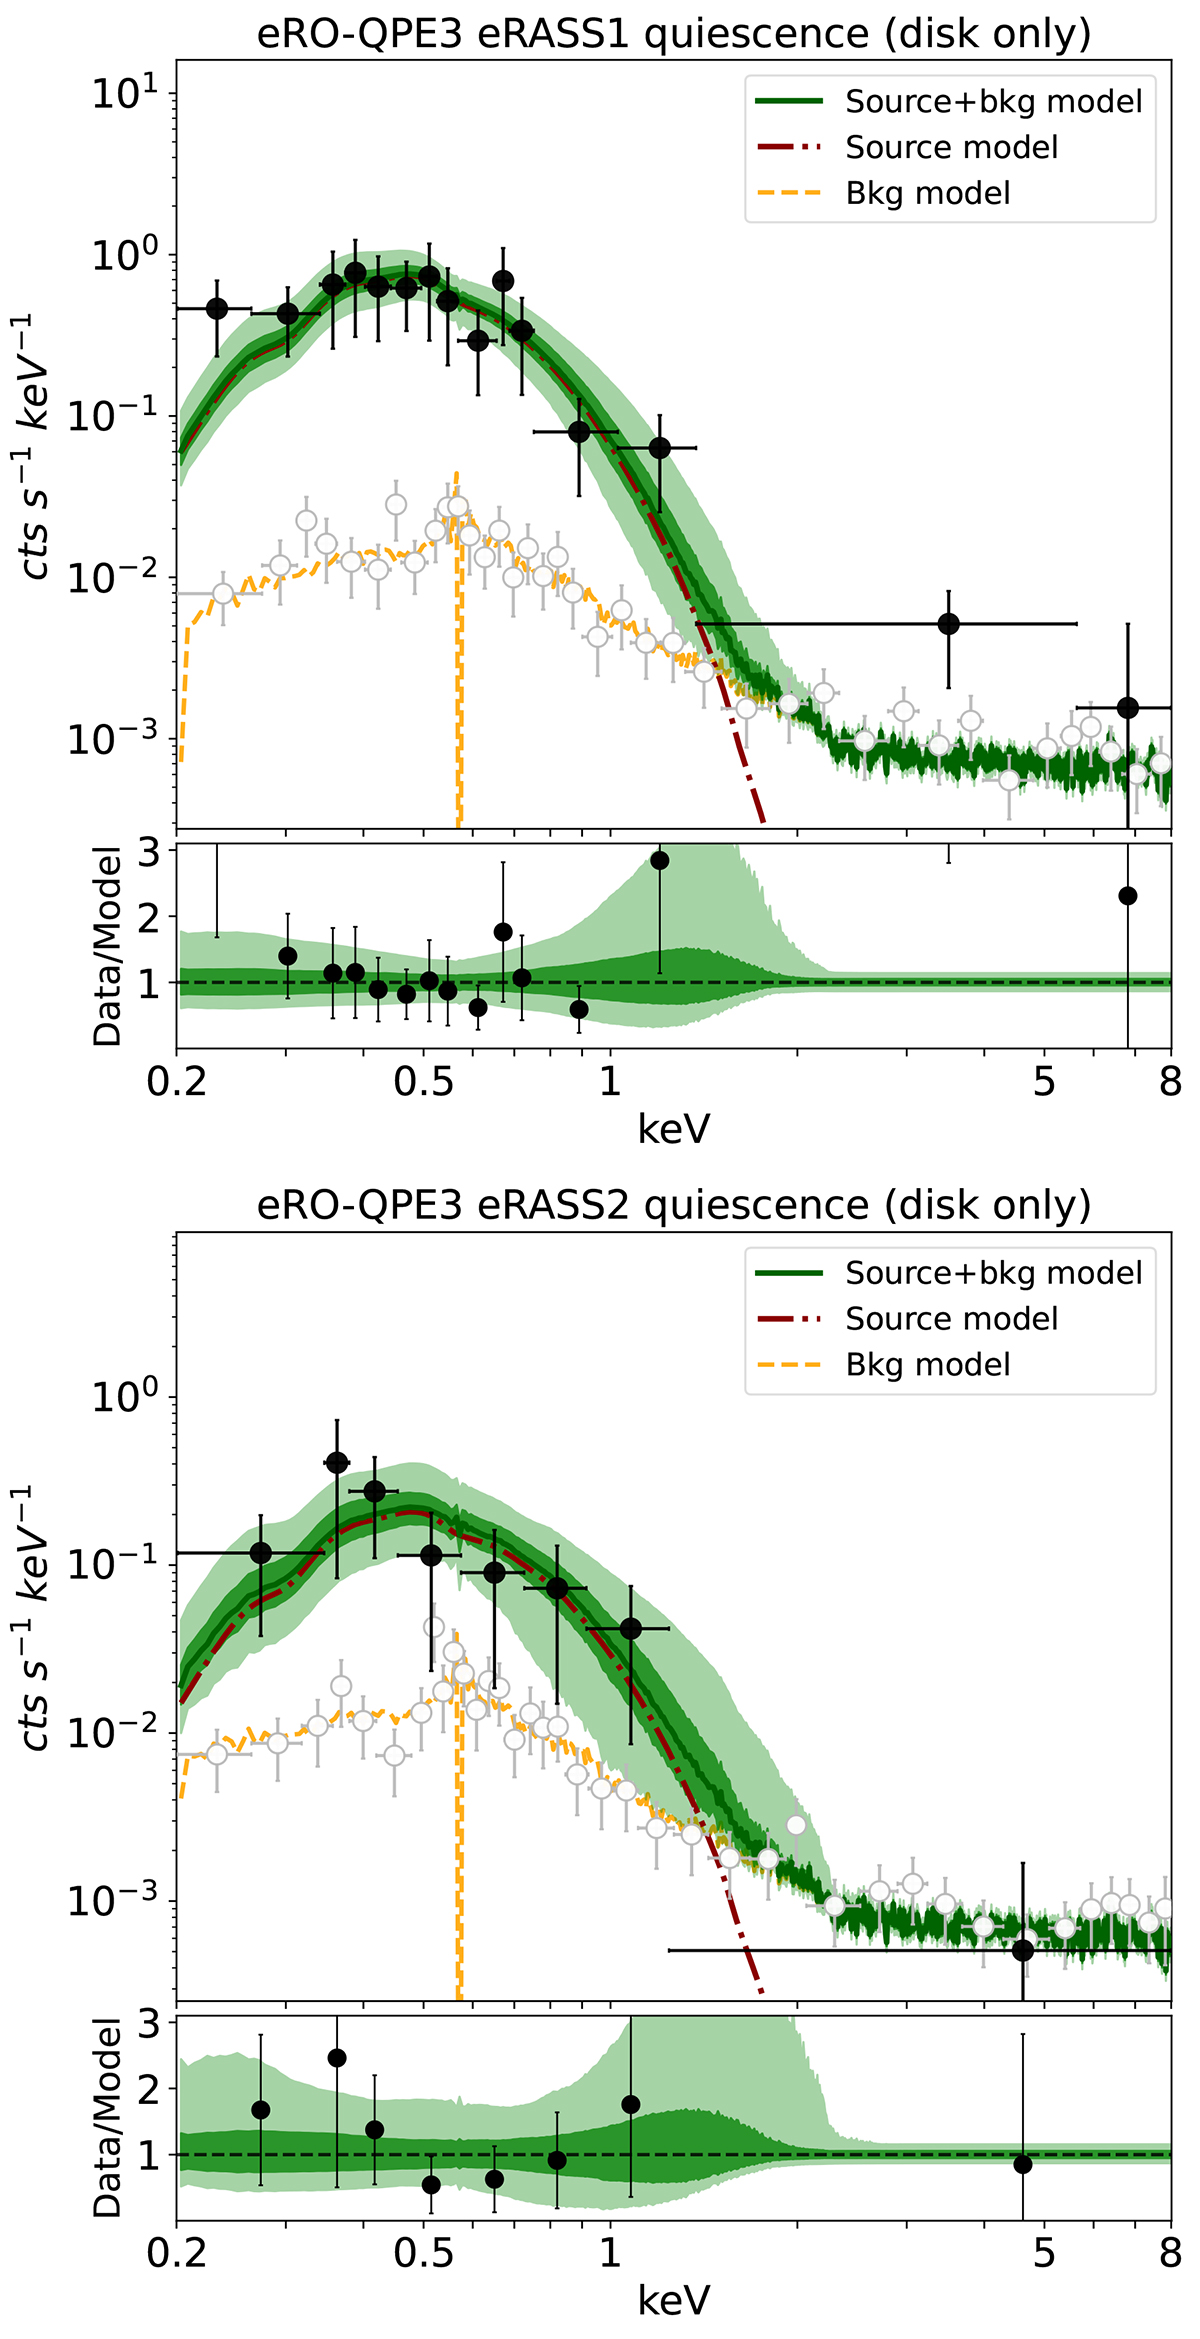
Spectral fit for the eRASS1 (top) and eRASS2 (bottom) spectra in quiescence modeled with a diskbb. Black points are source plus background data, empty gray points show the background alone. The green line and related light green (dark green) shaded regions are the source plus background model median and 1st-99th (16th-84th) percentiles, respectively. The orange dashed lines shows the background model alone. In the lower panel, the data-model ratio is shown. The individual absorption-corrected source model component (here a diskbb) is shown with a red line, as indicated by the legend.
Current usage metrics show cumulative count of Article Views (full-text article views including HTML views, PDF and ePub downloads, according to the available data) and Abstracts Views on Vision4Press platform.
Data correspond to usage on the plateform after 2015. The current usage metrics is available 48-96 hours after online publication and is updated daily on week days.
Initial download of the metrics may take a while.