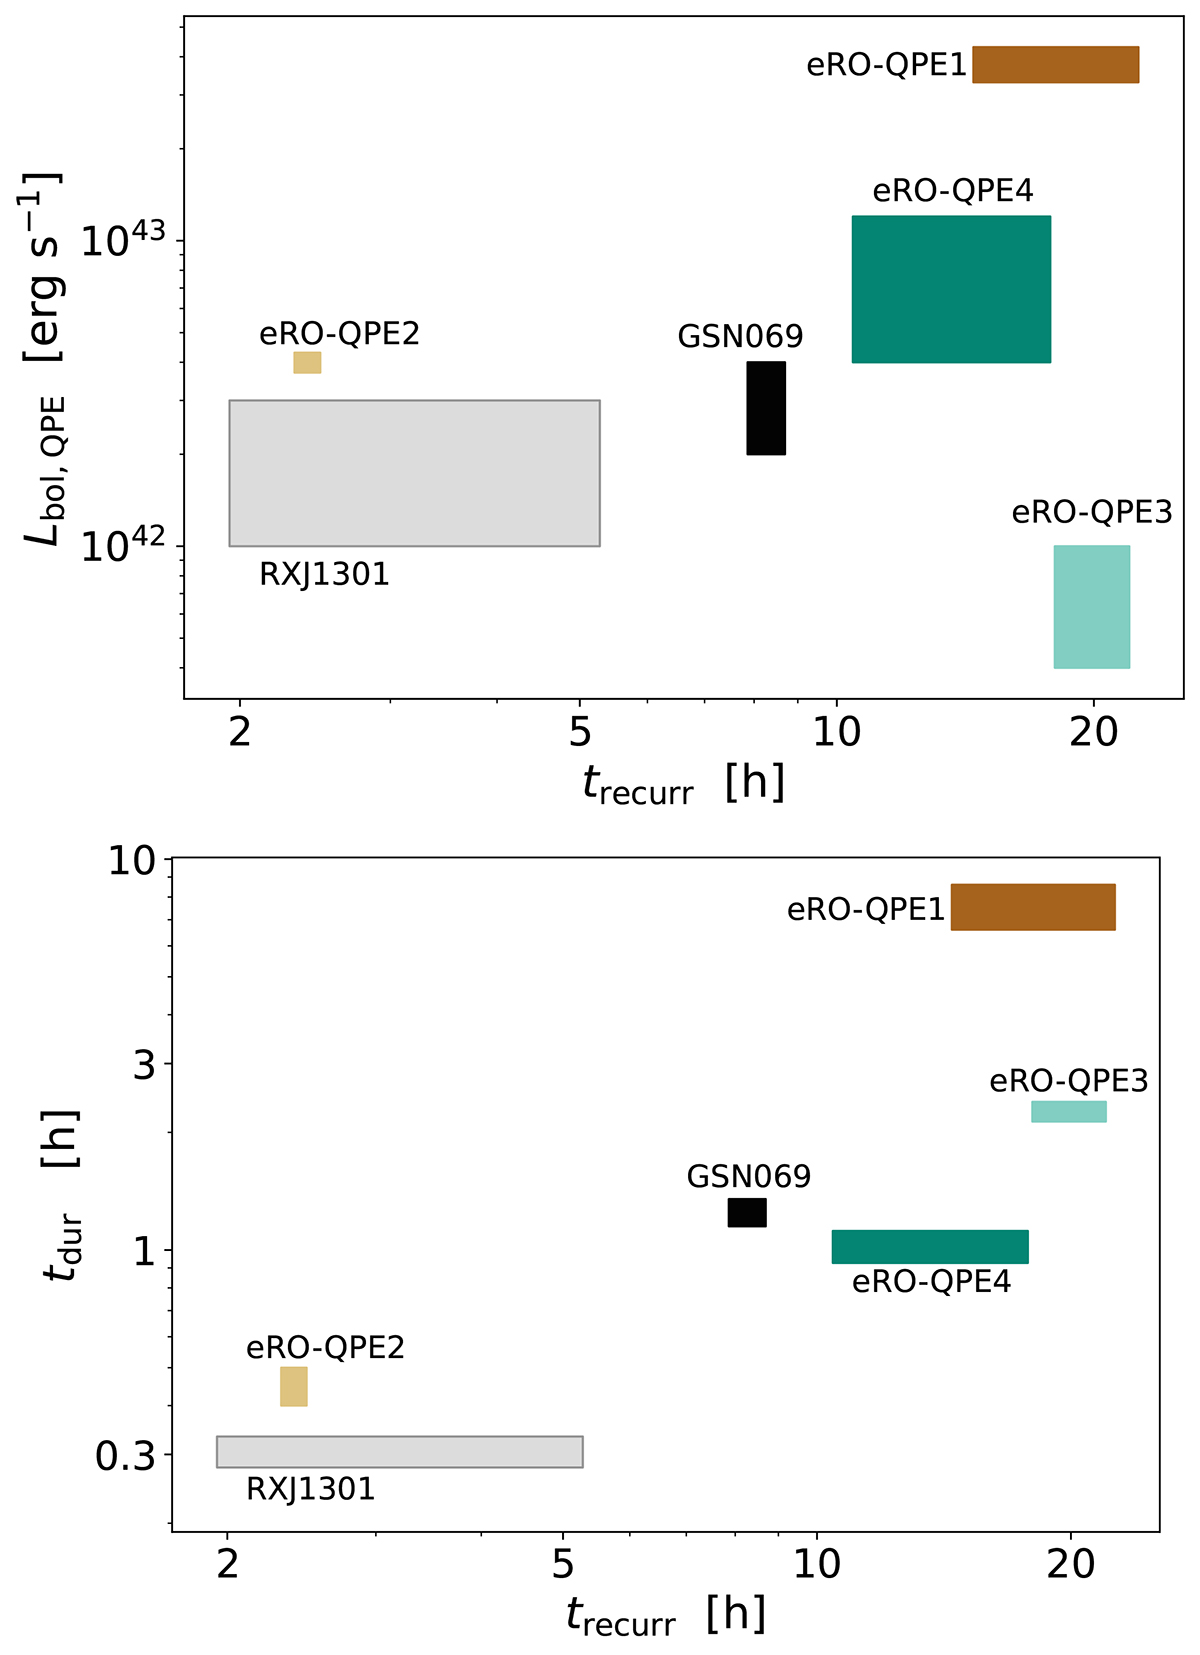
Fig. 13.
Download original image
Relation between recurrence and peak luminosity (top) and recurrence and duration timescales (bottom) in secure QPE sources, shown as labeled. The extent of shaded areas represents the standard deviation, when available, or the span within observed values in a given source. eRO-QPE3 is a clear outlier of the top panel, ruling out the presence of a predictive correlation between timescales and peak luminosity.
Current usage metrics show cumulative count of Article Views (full-text article views including HTML views, PDF and ePub downloads, according to the available data) and Abstracts Views on Vision4Press platform.
Data correspond to usage on the plateform after 2015. The current usage metrics is available 48-96 hours after online publication and is updated daily on week days.
Initial download of the metrics may take a while.