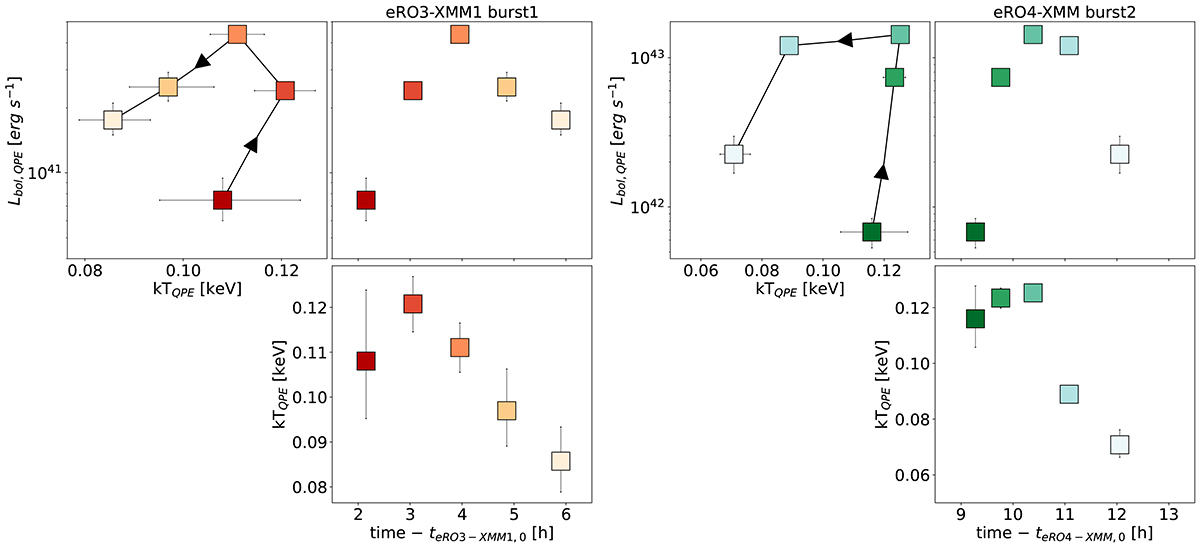
Fig. 10.
Download original image
Spectral evolution of QPEs in eRO-QPE3 (left) and eRO-QPE4 (right). The top-right (bottom) subpanels show the luminosity (temperature) evolution with time of the QPE component. Darker to lighter colors represent the evolution from start to end of the eruptions. The first eruptions of the eRO3-XMM1 observation and the second of the eRO4-XMM observation are taken as reference for the QPEs in eRO-QPE3 and eRO-QPE4, respectively. The top-left subpanels show the luminosity-temperature coevolution, analogous to the rate-hardness evolution in Arcodia et al. (2022) which first reported the hysteresis cycle.
Current usage metrics show cumulative count of Article Views (full-text article views including HTML views, PDF and ePub downloads, according to the available data) and Abstracts Views on Vision4Press platform.
Data correspond to usage on the plateform after 2015. The current usage metrics is available 48-96 hours after online publication and is updated daily on week days.
Initial download of the metrics may take a while.