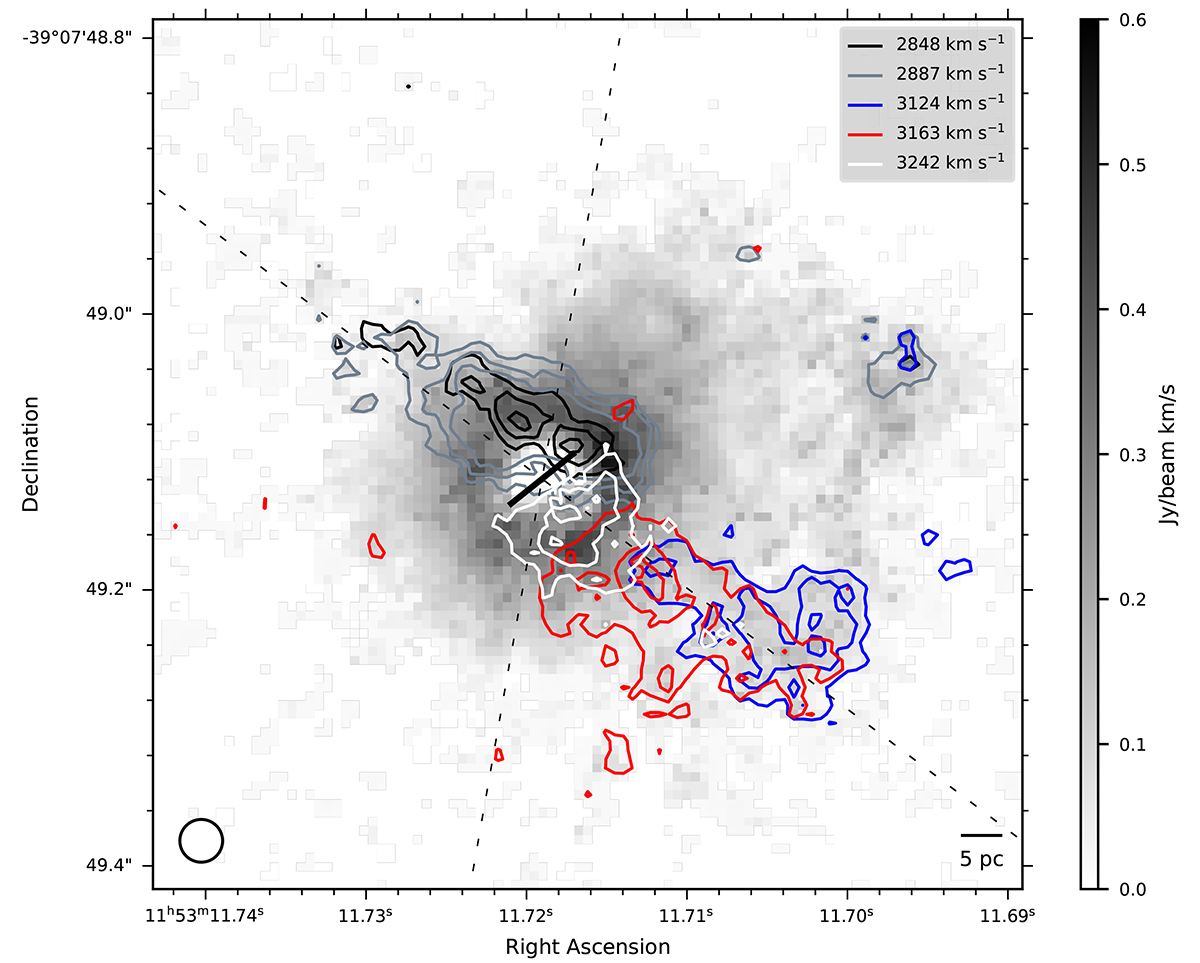
Fig. 6.
Download original image
Integrated ground-state HCN ν = 0 J = 3 − 2 emission (gray scale), and 36 MHz (∼40 km s−1) wide channel maps with contours at 0.14 × (5, 7, and 9) mJy. The blue contours show the approaching side of the redshifted lobe, and the red contours show the receding side of the redshifted lobe. The white contours show some of the highest velocity gas. Black and gray contours show the blueshifted lobe.
Current usage metrics show cumulative count of Article Views (full-text article views including HTML views, PDF and ePub downloads, according to the available data) and Abstracts Views on Vision4Press platform.
Data correspond to usage on the plateform after 2015. The current usage metrics is available 48-96 hours after online publication and is updated daily on week days.
Initial download of the metrics may take a while.