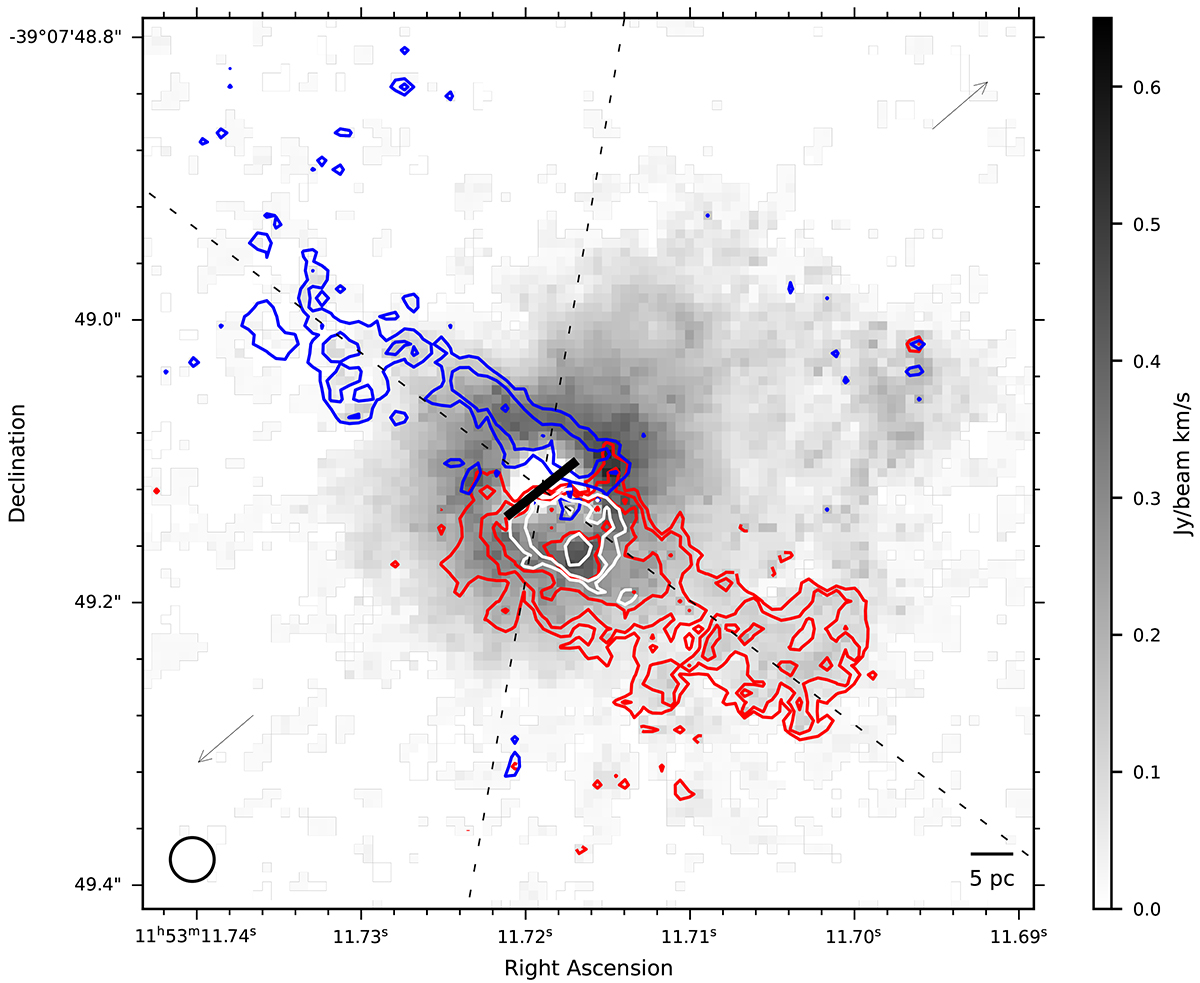
Fig. 5.
Download original image
Integrated ground-state HCN ν = 0 J = 3 − 2 emission (gray scale), with |v|> 100 km s−1 (with respect to the systemic velocity) contours at 0.015 × (3, 5, 8, and 13) Jy km s−1. The blue contours show the approaching outflow, and the red contours show the receding outflow. The white contours show the v > 200 km s−1 gas. The black line indicates the major axis of the two-dimensional Gaussian fit to the peak intensity of the continuum. The dashed black line indicates the orientation of the outflow indicated by Pereira-Santaella et al. (2016, 2020), and the arrows indicate the tentative direction of a radio elongation from Hekatelyne et al. (2020).
Current usage metrics show cumulative count of Article Views (full-text article views including HTML views, PDF and ePub downloads, according to the available data) and Abstracts Views on Vision4Press platform.
Data correspond to usage on the plateform after 2015. The current usage metrics is available 48-96 hours after online publication and is updated daily on week days.
Initial download of the metrics may take a while.