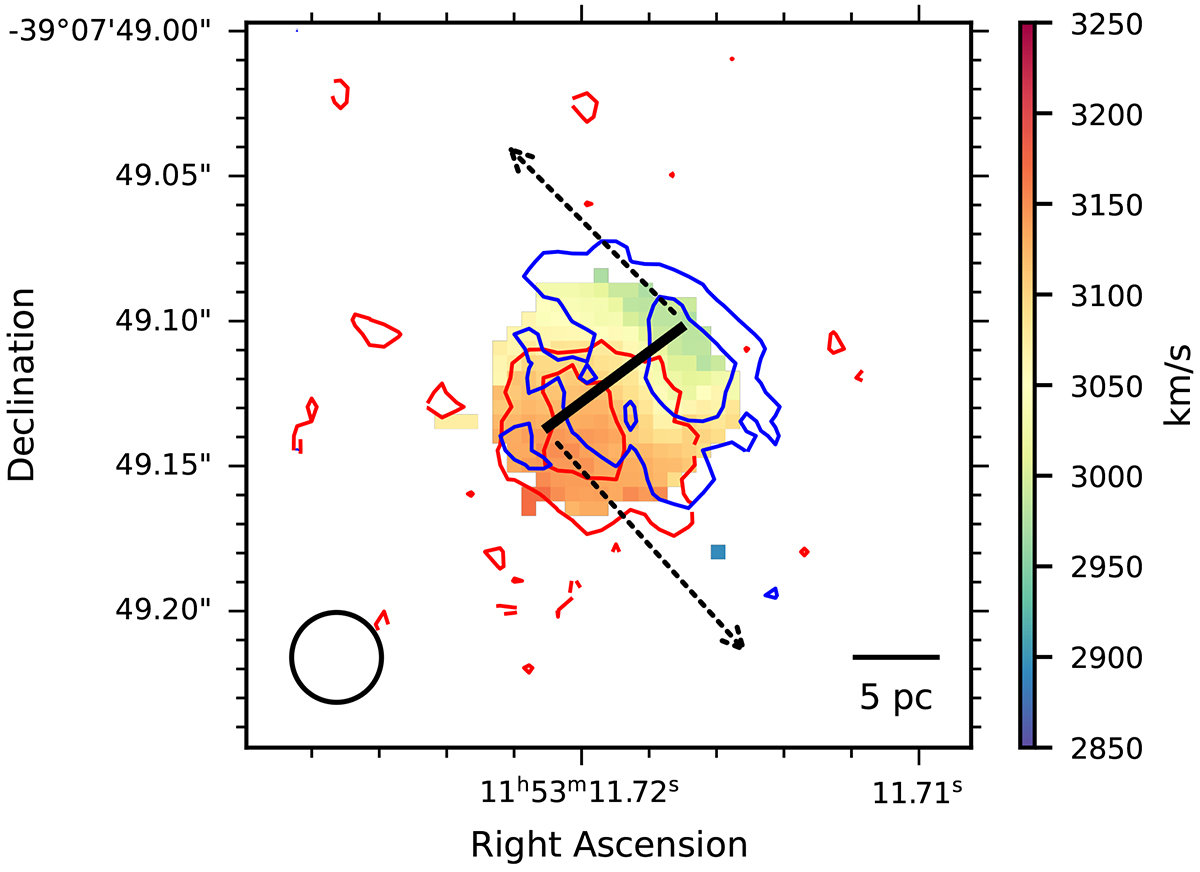
Fig. 4.
Download original image
Intensity-weighted velocity field (moment 1) of the vibrationally excited HCN-vib transition, showing the base of the outflow. The black line indicates the major axis of the two-dimensional Gaussian fit to the peak intensity of the continuum. The rough location and direction of the outflow is indicated by the dashed arrows. Rotation is seen along the major axis of the continuum, with the blueshifted side to the northwest. The red and blue contours are integrated flux maps of |v|> 100 km s−1 HCN-vib emission with levels at three and eight times 0.012 Jy km s−1. These contours show that the HCN-vib emission is extended along the outflow, and that the outflow is launched from similarly rotating sides of the nucleus.
Current usage metrics show cumulative count of Article Views (full-text article views including HTML views, PDF and ePub downloads, according to the available data) and Abstracts Views on Vision4Press platform.
Data correspond to usage on the plateform after 2015. The current usage metrics is available 48-96 hours after online publication and is updated daily on week days.
Initial download of the metrics may take a while.