Fig. 3.
Download original image
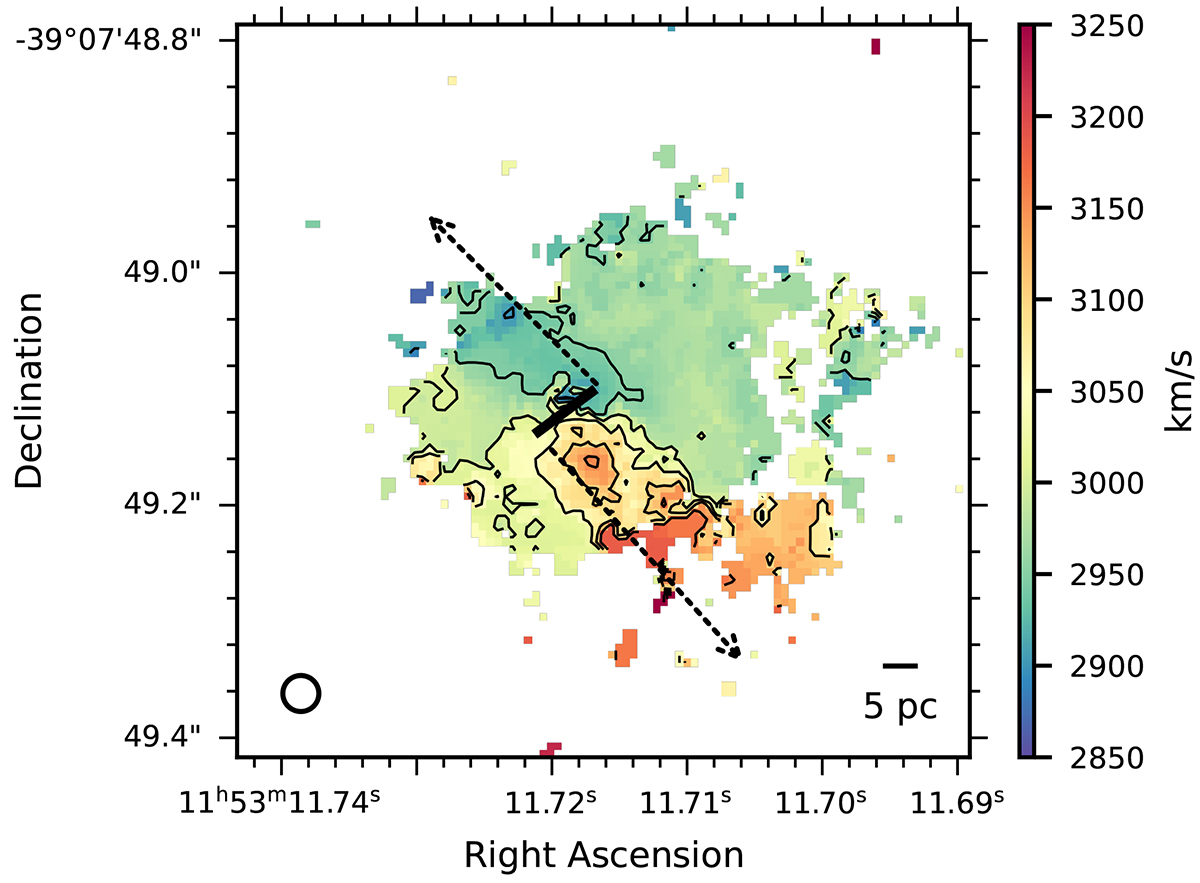
Intensity-weighted velocity map (moment 1) of the ground-state HCN J = 3 − 2 transition. The contours range from 2850 km s−1 to 3250 km s−1 with steps of 50 km s−1. The black line indicates the major axis of the two-dimensional Gaussian fit to the peak intensity of the continuum. The rough location and direction of the outflow (this work) is indicated by the dashed arrows.
Current usage metrics show cumulative count of Article Views (full-text article views including HTML views, PDF and ePub downloads, according to the available data) and Abstracts Views on Vision4Press platform.
Data correspond to usage on the plateform after 2015. The current usage metrics is available 48-96 hours after online publication and is updated daily on week days.
Initial download of the metrics may take a while.