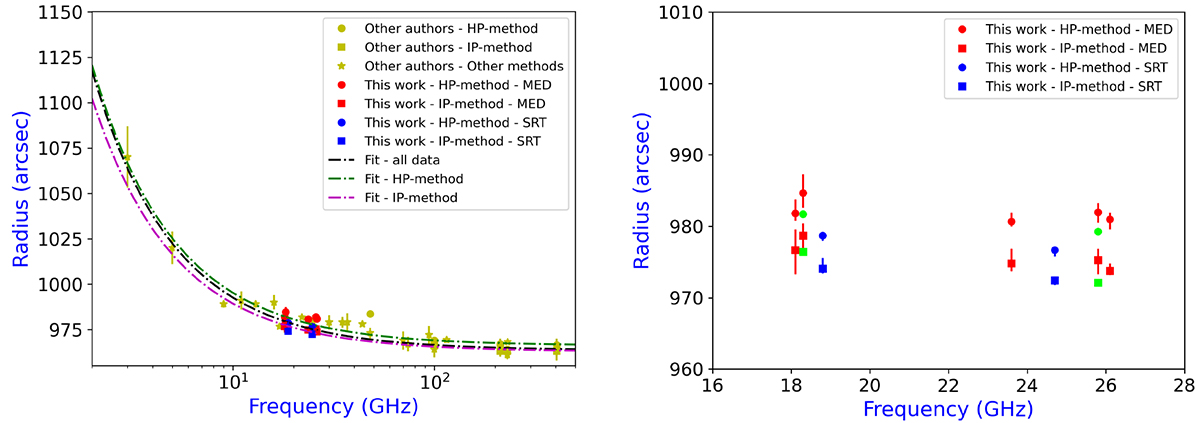
Fig. 9.
Download original image
Solar radius as a function of the observing frequency. Left: plot with our measures of Rc obtained through the modelling. The dashed lines represent the fitted exponential trend (black: all data; green: HP method; magenta: IP method). The yellow points show previous measurements from other authors (see Table 1 in Menezes & Valio 2017; Menezes et al. 2022, and references therein), and the circle and squared points are our radius values derived from Grueff and SRT. Right: plot with our measures of Rc obtained through the HP method (circle points) and the IP method (squared points). The green points indicate the measures of Rc obtained from the averaged solar maps of the Grueff Radio Telescope through the HP method (circle points) and the IP method (squared points).
Current usage metrics show cumulative count of Article Views (full-text article views including HTML views, PDF and ePub downloads, according to the available data) and Abstracts Views on Vision4Press platform.
Data correspond to usage on the plateform after 2015. The current usage metrics is available 48-96 hours after online publication and is updated daily on week days.
Initial download of the metrics may take a while.