Open Access
Fig. 8.
Download original image
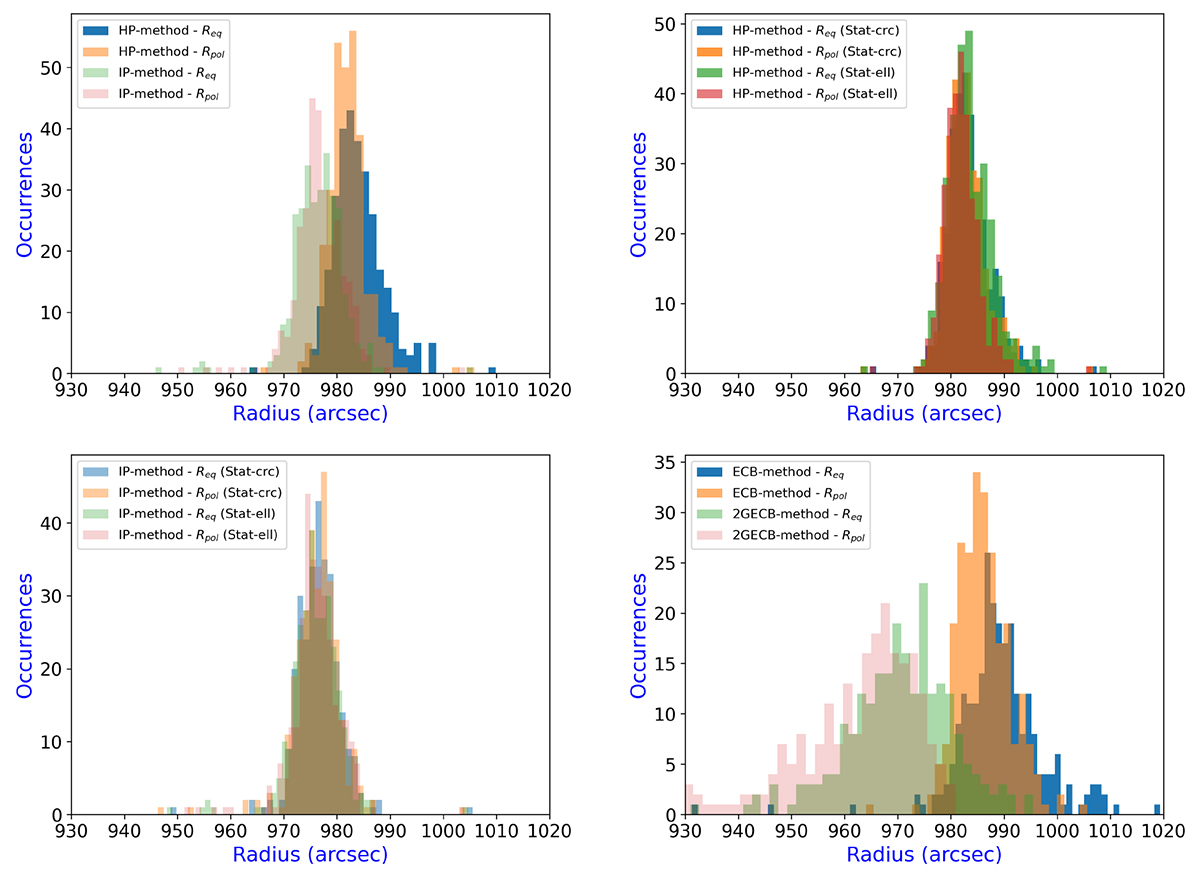
Histograms depicting all the Req and Rpol measurements calculated from (top left) the HP- and IP methods, (top right) the statistical approach using the HP method, (bottom left) the statistical approach using the IP method, and (bottom right) the ECB and 2GECB methods.
Current usage metrics show cumulative count of Article Views (full-text article views including HTML views, PDF and ePub downloads, according to the available data) and Abstracts Views on Vision4Press platform.
Data correspond to usage on the plateform after 2015. The current usage metrics is available 48-96 hours after online publication and is updated daily on week days.
Initial download of the metrics may take a while.