Fig. 6.
Download original image
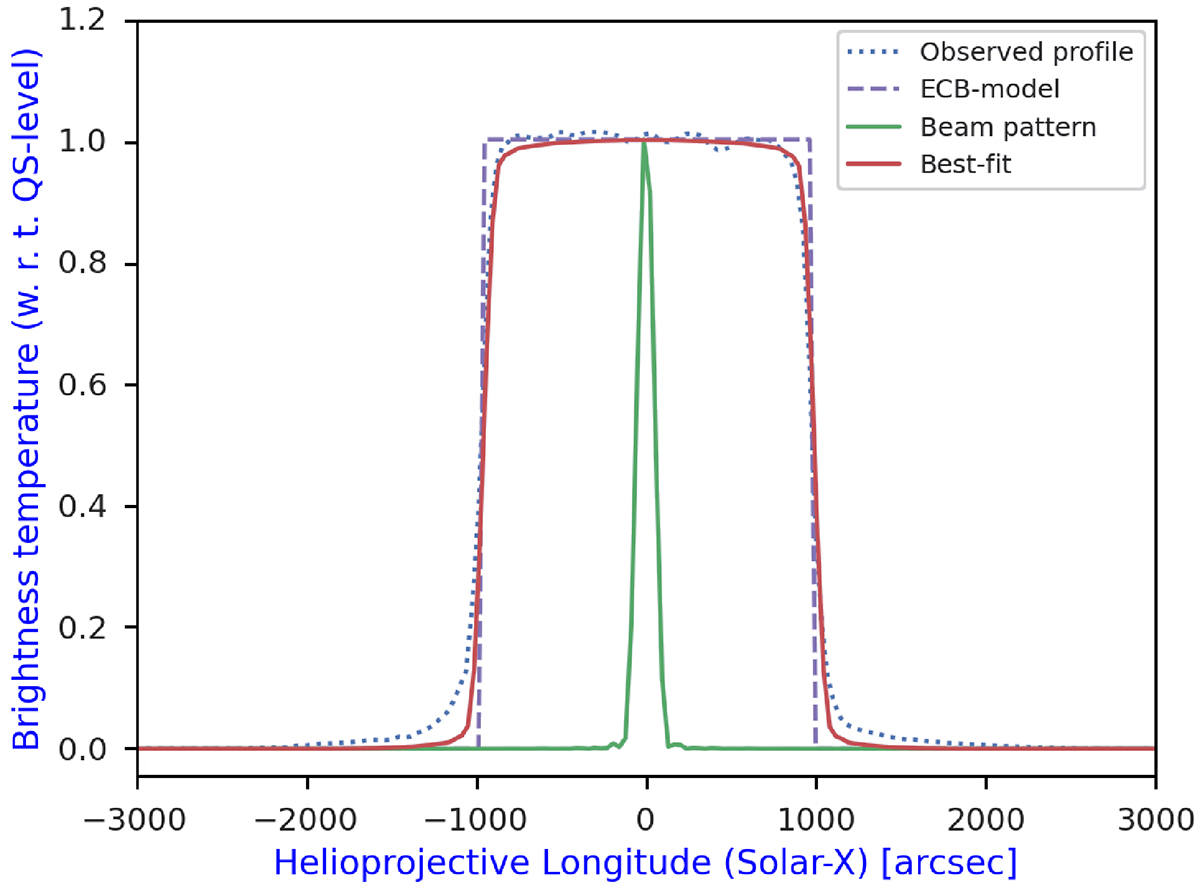
Example of the analysis with the ECB model using the solar signal in the Grueff Radio Telescope at 18.3 GHz on September 2, 2020. The solid green line indicates the instrumental beam pattern, the dashed blue line indicates the observed equatorial TB profile of the solar map, the dotted violet line indicates the modelled equatorial TB profile of the ECB model (Eq. (3)), and the solid red line indicates the convolved best-fit TB profile using the instrumental beam pattern and the ECB model as the solar signal.
Current usage metrics show cumulative count of Article Views (full-text article views including HTML views, PDF and ePub downloads, according to the available data) and Abstracts Views on Vision4Press platform.
Data correspond to usage on the plateform after 2015. The current usage metrics is available 48-96 hours after online publication and is updated daily on week days.
Initial download of the metrics may take a while.