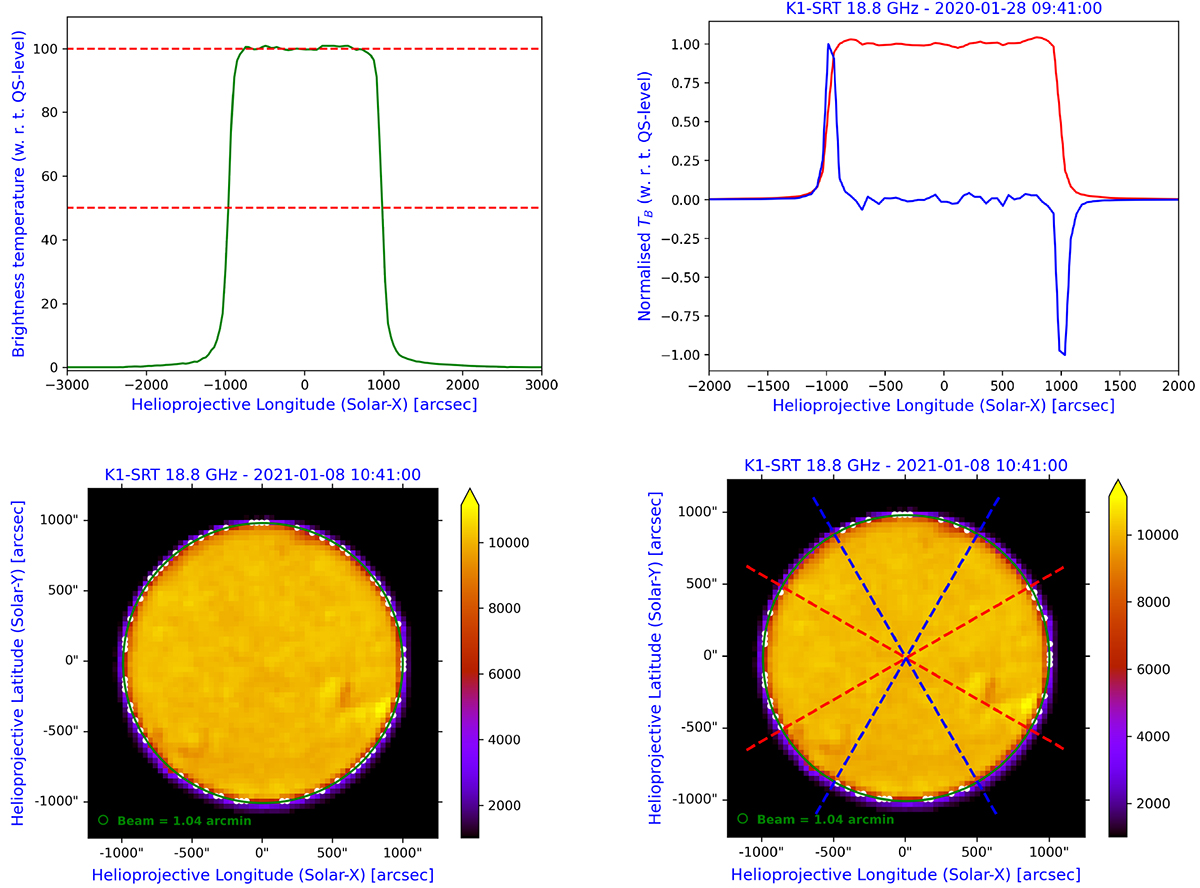
Fig. 3.
Download original image
Steps of a solar radius measurement. Top left: brightness profile with the TB levels (dashed red lines) of TqS (top line) and the half value of TqS (bottom line) used in the HP method. Top right: numerical differentiation of the brightness profile (blue curve), whose minimum and maximum points correspond to the limb coordinates of the equatorial scan (red curve) in the IP method. Bottom left: limb coordinates (white points) extracted from a solar map with a fit (circle or ellipse, solid green line). Bottom right: limb coordinates (white points) extracted from a solar map with the statistical procedure to estimate ![]() and
and ![]() (the dashed red and blue lines are the constraints of the equatorial and the polar regions, respectively).
(the dashed red and blue lines are the constraints of the equatorial and the polar regions, respectively).
Current usage metrics show cumulative count of Article Views (full-text article views including HTML views, PDF and ePub downloads, according to the available data) and Abstracts Views on Vision4Press platform.
Data correspond to usage on the plateform after 2015. The current usage metrics is available 48-96 hours after online publication and is updated daily on week days.
Initial download of the metrics may take a while.