Fig. 1.
Download original image
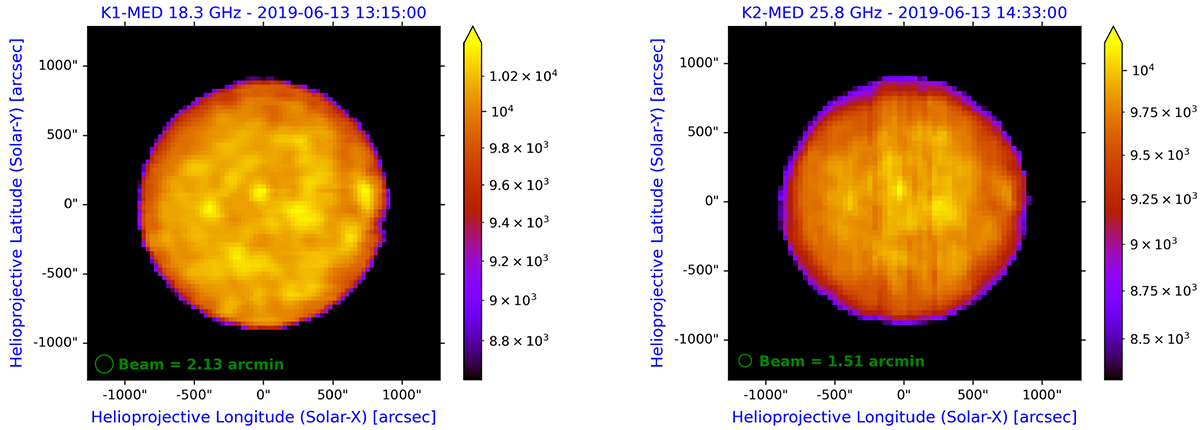
Solar disk image at 18.3 GHz (left) and 25.8 GHz (right) obtained with the Grueff Radio Telescope on June 13, 2019, processed with the SUNDARA package (Marongiu et al. 2021). The colour bars indicate TB of the solar maps in units of Kelvin. The green circles in the lower left corner of each map mark the HPBW at the observed frequencies.
Current usage metrics show cumulative count of Article Views (full-text article views including HTML views, PDF and ePub downloads, according to the available data) and Abstracts Views on Vision4Press platform.
Data correspond to usage on the plateform after 2015. The current usage metrics is available 48-96 hours after online publication and is updated daily on week days.
Initial download of the metrics may take a while.