Fig. 7.
Download original image
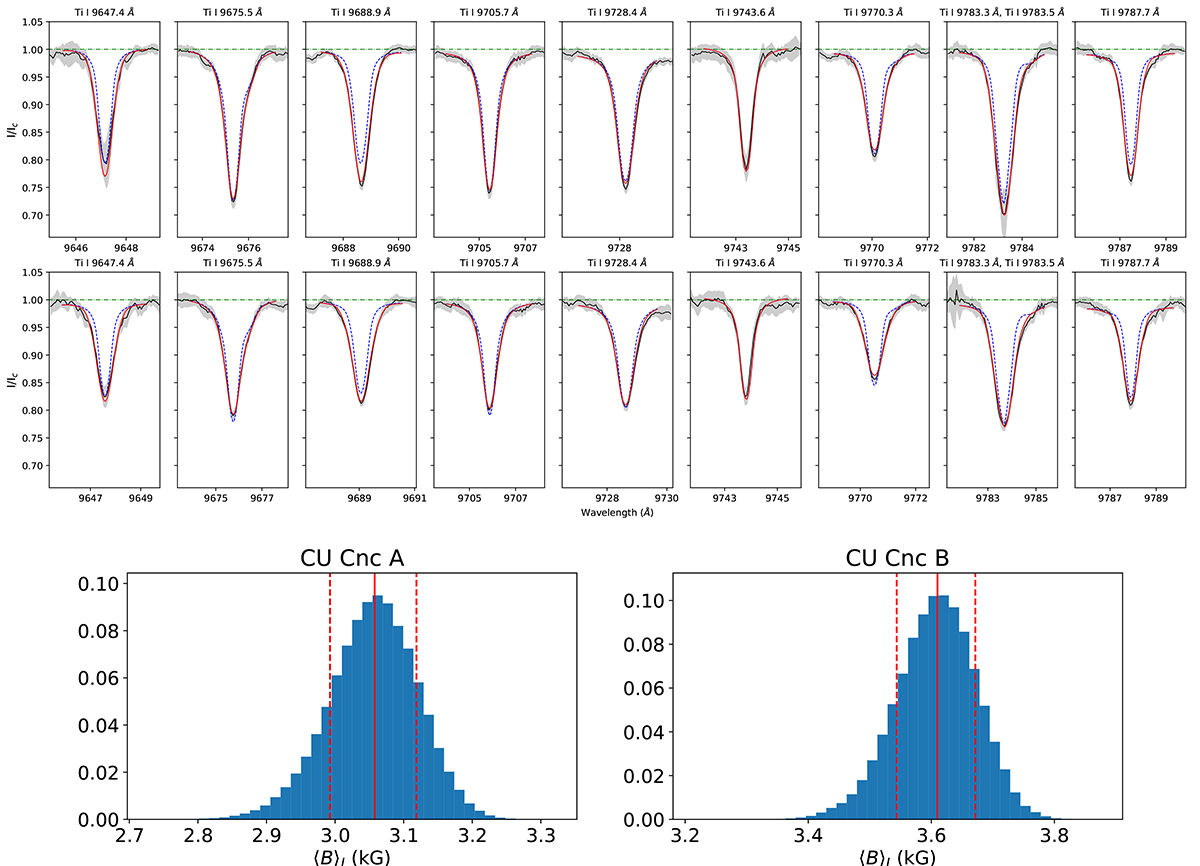
Fits to the disentangled spectra and resulting posteriors of the average small-scale magnetic field strength. Top: Studied Ti I lines, with observations in black, the median parameter model in red, and non-magnetic spectra with otherwise identical parameters in dashed blue. The two rows correspond to the primary (first row) and secondary (second row) components. Bottom: Posterior distributions of the average magnetic field strength of the two components, with the median and 68% credence regions marked with vertical red lines.
Current usage metrics show cumulative count of Article Views (full-text article views including HTML views, PDF and ePub downloads, according to the available data) and Abstracts Views on Vision4Press platform.
Data correspond to usage on the plateform after 2015. The current usage metrics is available 48-96 hours after online publication and is updated daily on week days.
Initial download of the metrics may take a while.