Fig. 3.
Download original image
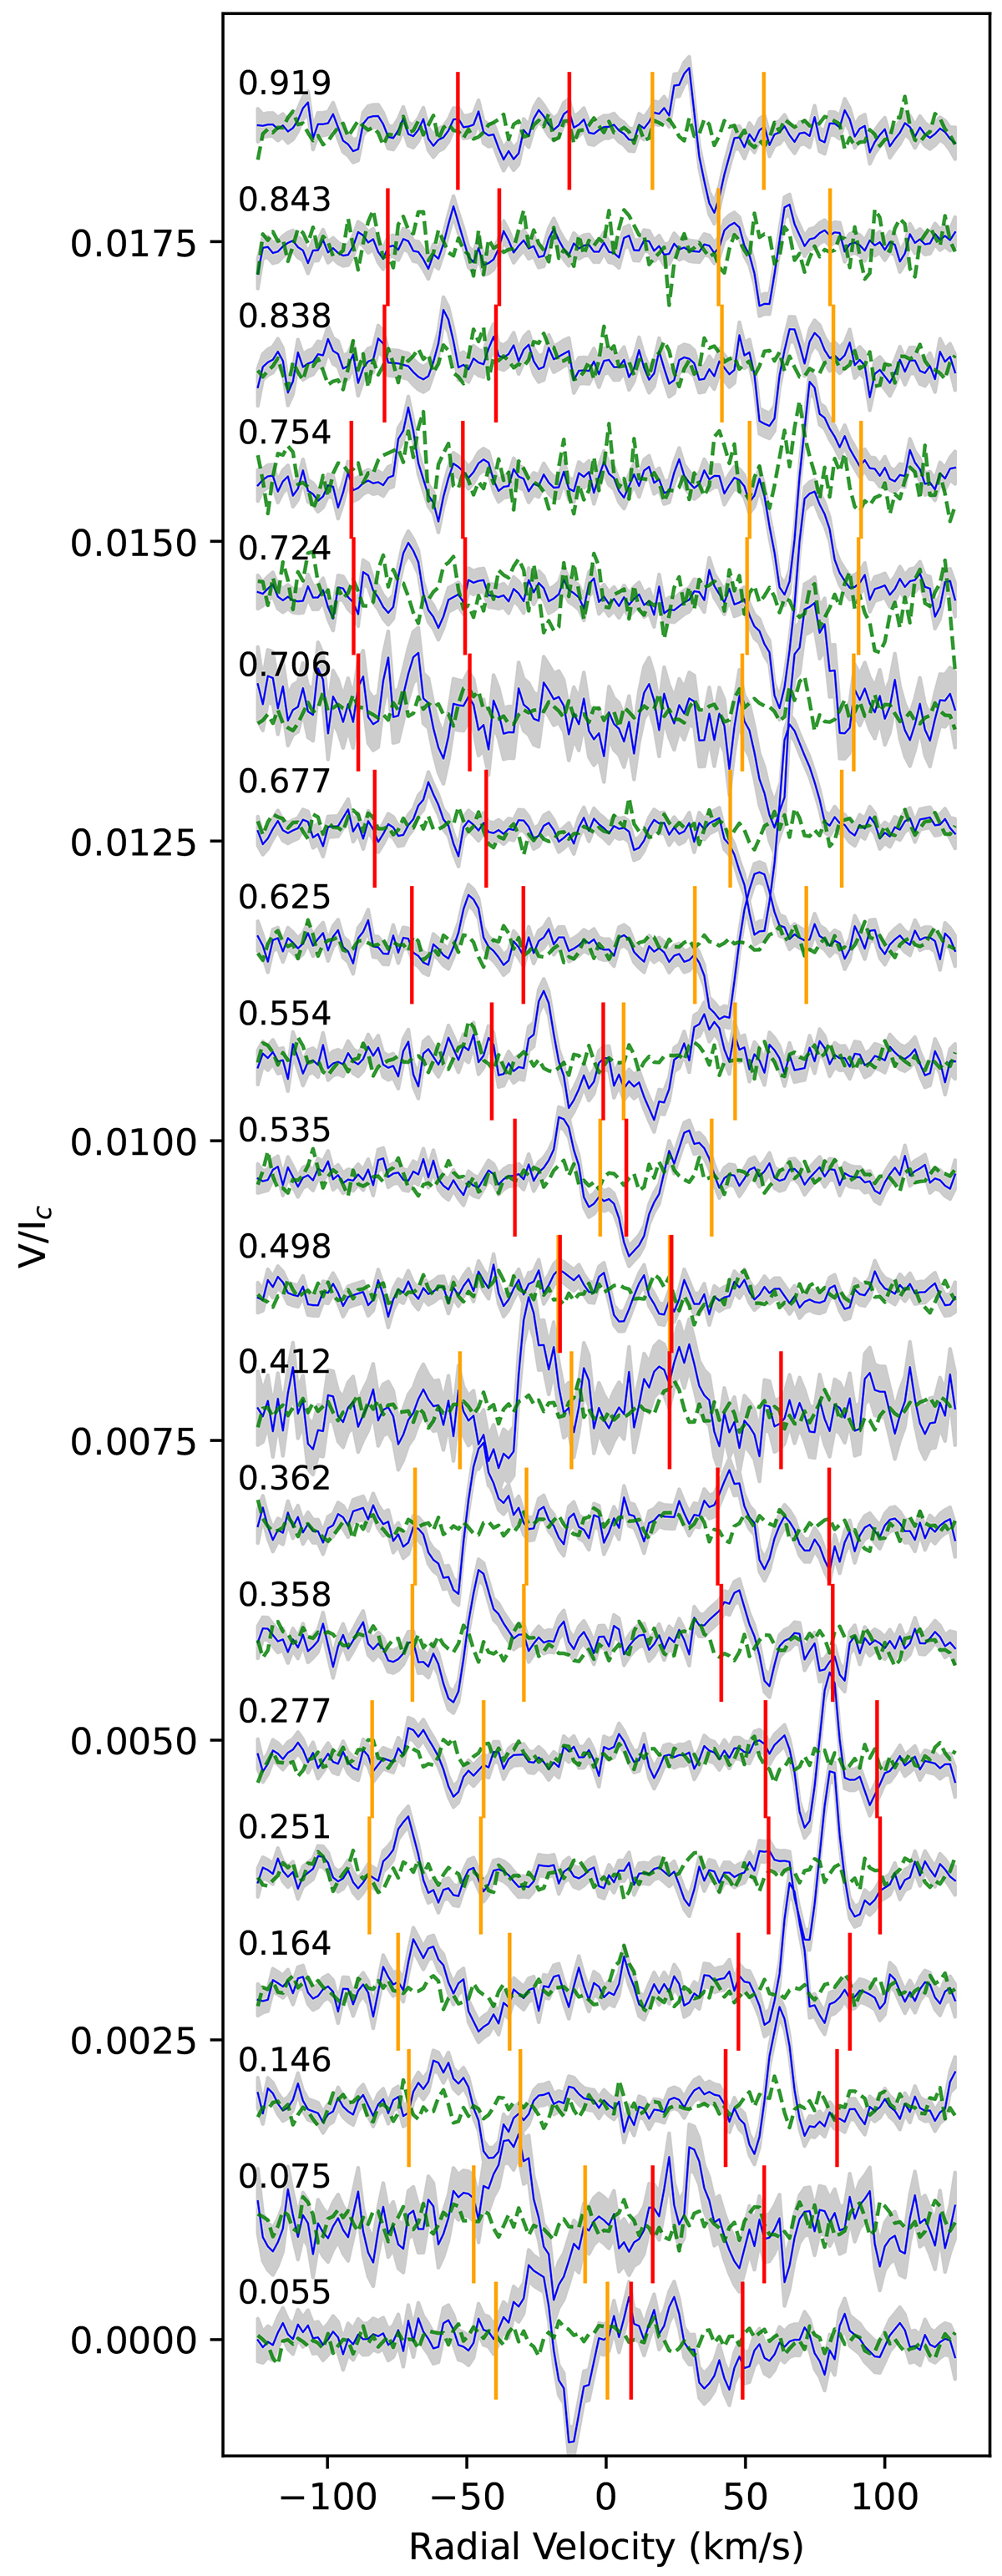
Observed Stokes V LSD profiles. The shaded grey area represents the uncertainty of each LSD profile. The null polarisation profiles are shown with the dashed green lines. The vertical bars indicate velocity intervals for the calculations of the FAP and ⟨Bz⟩ for the primary (orange bars) and secondary (red bars). The spectra are offset vertically according to the orbital phase. The phases for each observation are shown on the left-hand side and are calculated from the orbital solution derived in Sect. 3.1.
Current usage metrics show cumulative count of Article Views (full-text article views including HTML views, PDF and ePub downloads, according to the available data) and Abstracts Views on Vision4Press platform.
Data correspond to usage on the plateform after 2015. The current usage metrics is available 48-96 hours after online publication and is updated daily on week days.
Initial download of the metrics may take a while.