Fig. 7
Download original image
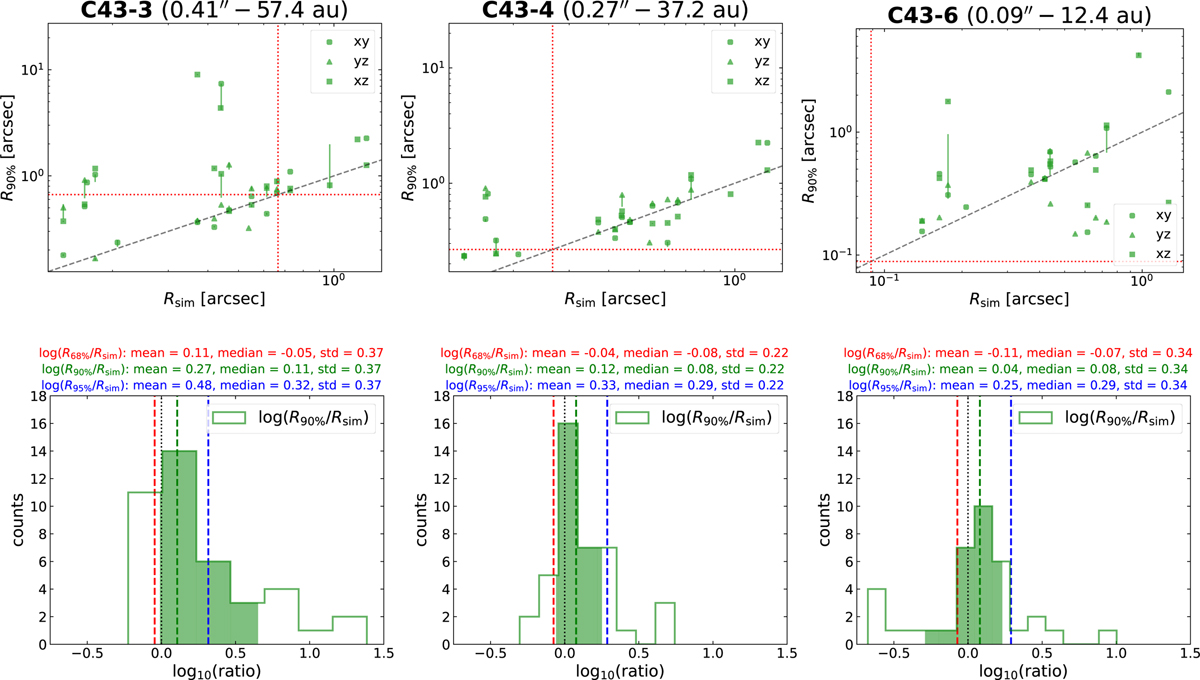
Comparison of the disk sizes measured from the observations with three different angular resolutions (0.41″, 0.266″, 0.887″). R90% radius of the observed disks versus their theoretical sizes for three configuration C43-3 (left), C43-4 (middle), and C43-6 (right), shown at the top. Histograms of the R90%/Rsim ratio for the reported configurations, shown at the bottom.
Current usage metrics show cumulative count of Article Views (full-text article views including HTML views, PDF and ePub downloads, according to the available data) and Abstracts Views on Vision4Press platform.
Data correspond to usage on the plateform after 2015. The current usage metrics is available 48-96 hours after online publication and is updated daily on week days.
Initial download of the metrics may take a while.