Fig. 6
Download original image
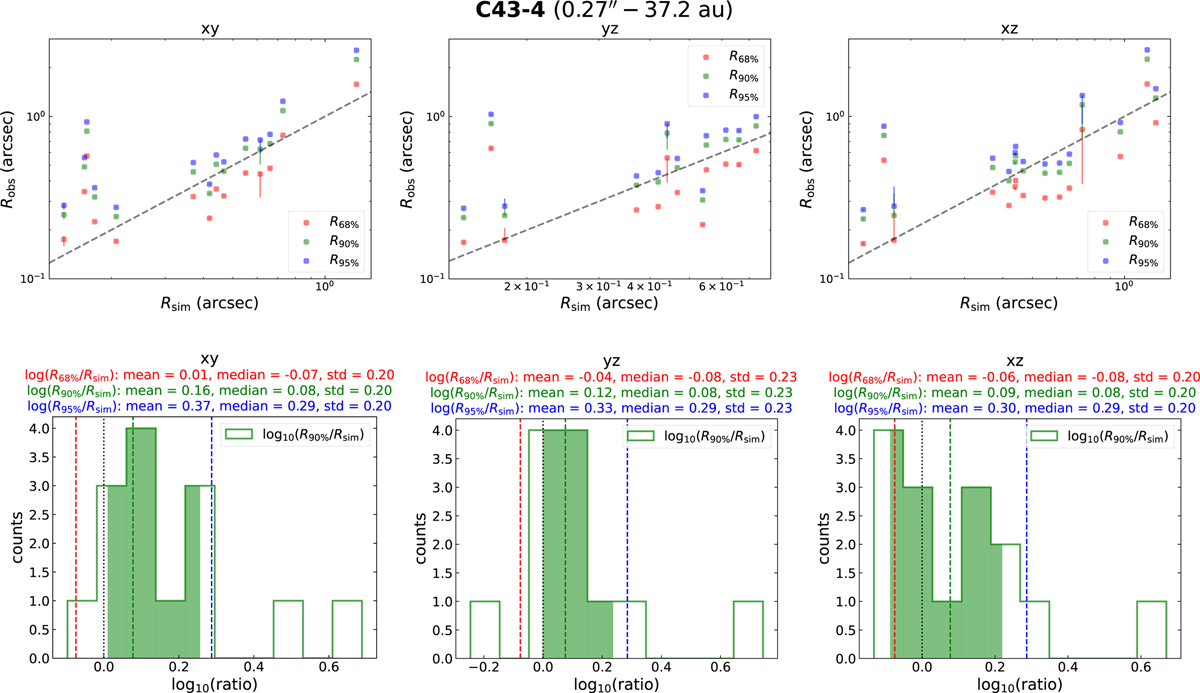
Comparison of the disk sizes measured from the observations with the C43-4 configuration and the theoretical radii. Disk sizes in arcsecs obtained from the modelling of CASA observations vs. the values derived from the gas kinematics in the simulation for all single star-disk systems present in the output, seen in three projections: xy (left), yz (middle), and xz (right), shown at the top. Black dashed line shows the one-to-one correlation. Histograms of the R90%/Rsim ratio for the three projections, shown at the bottom. Black dotted line marks R90%/Rsim = 1, where the two are in full agreement. Vertical dashed lines show the medians of the ratio distributions of three radii R68% (red), R90% (green), and R95% (blue). The values within the 16th to the 84th percentiles are covered by the shaded areas. The statistics (including the mean, median, and standard deviation) for the three radii are indicated above each panel.
Current usage metrics show cumulative count of Article Views (full-text article views including HTML views, PDF and ePub downloads, according to the available data) and Abstracts Views on Vision4Press platform.
Data correspond to usage on the plateform after 2015. The current usage metrics is available 48-96 hours after online publication and is updated daily on week days.
Initial download of the metrics may take a while.