Fig. 5
Download original image
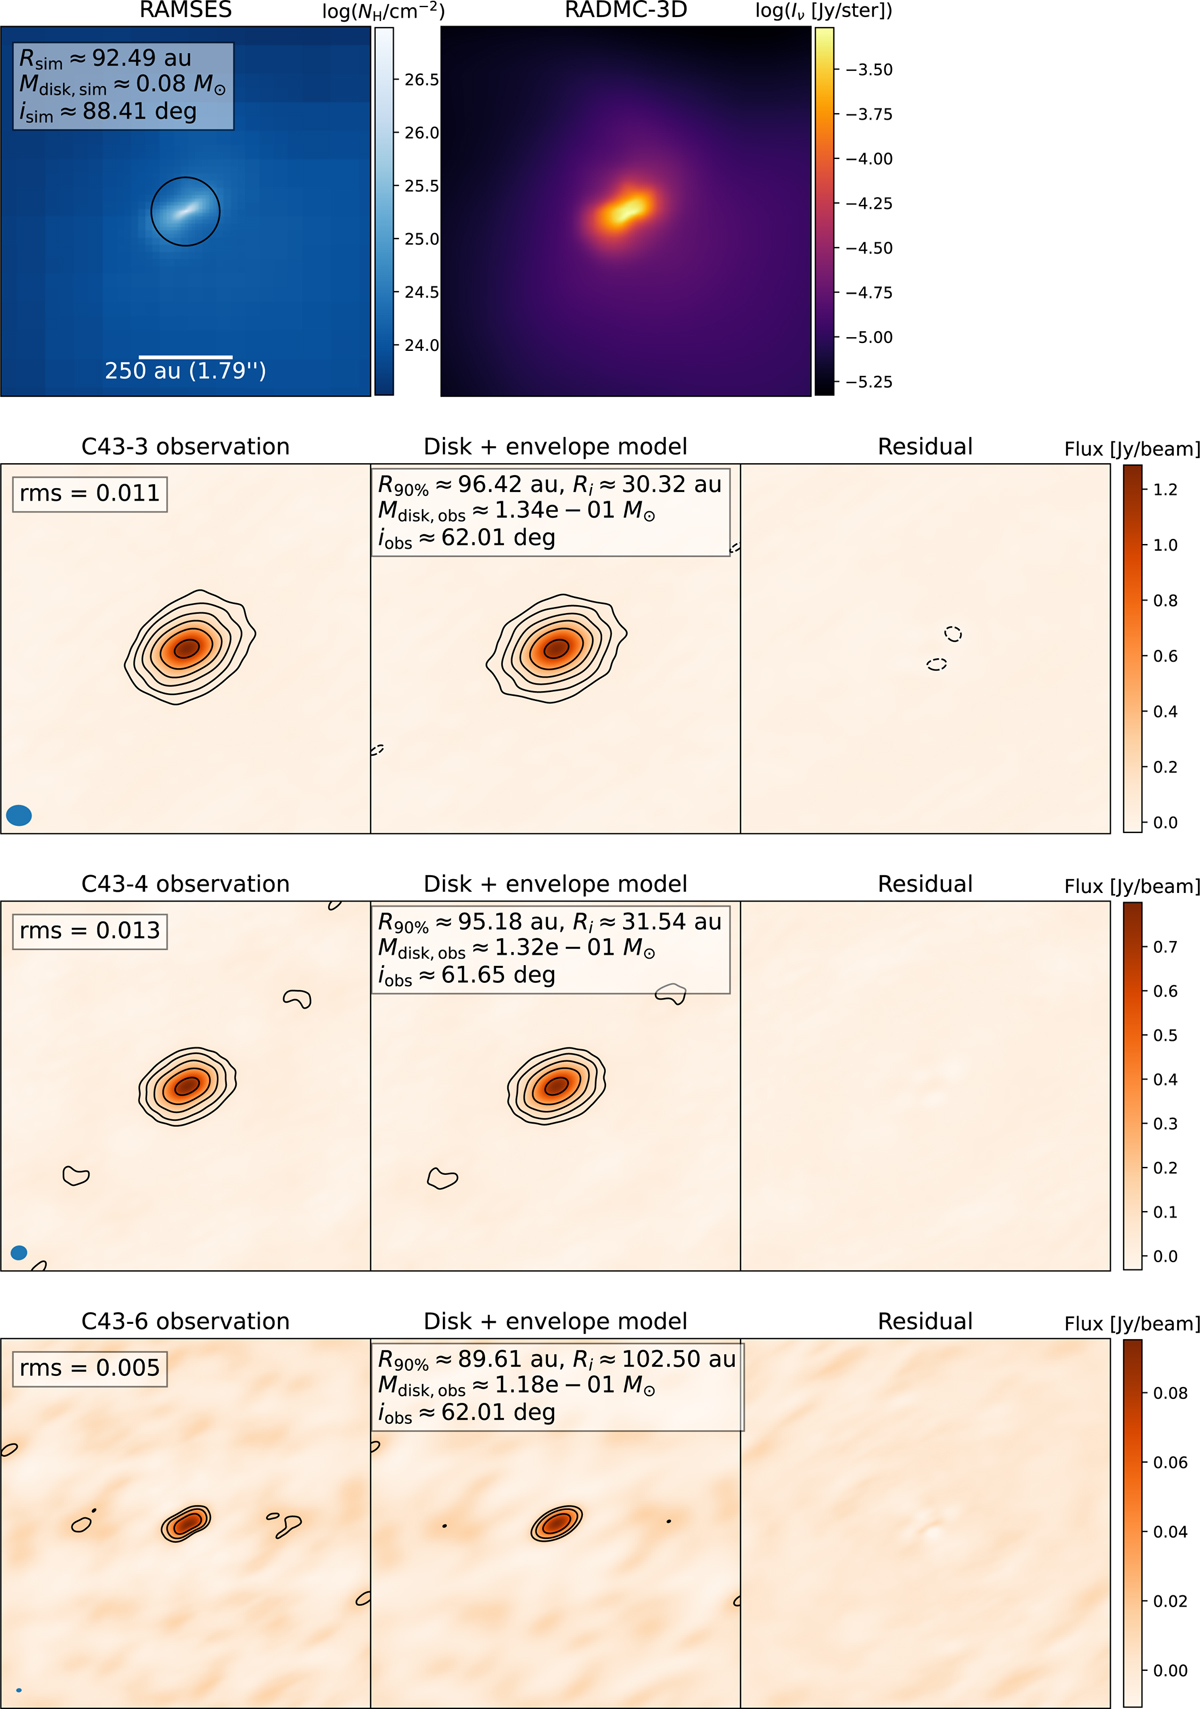
Modelling results imaged for the disk around sink 57. Column density plot from the RAMSES output with the circle enclosing the disk size (top panel) derived from simulation (left), and dust continuum image obtained with RADMC-3D (right) of the 1000 au region around the star. The CASA emission map imaged (bottom panel) with tclean from the simobserve visibilities with C43-4 (left), emission map of the best-fit model obtained with tclean (middle), and the corresponding residual (right). Contour lines are plotted at 3, 6, 12, 24, 48, and 96 multiples of the rms, σ. The disk properties inferred from the simulation and their modelled properties from observations are noted in the corresponding panels.
Current usage metrics show cumulative count of Article Views (full-text article views including HTML views, PDF and ePub downloads, according to the available data) and Abstracts Views on Vision4Press platform.
Data correspond to usage on the plateform after 2015. The current usage metrics is available 48-96 hours after online publication and is updated daily on week days.
Initial download of the metrics may take a while.