Fig. 4
Download original image
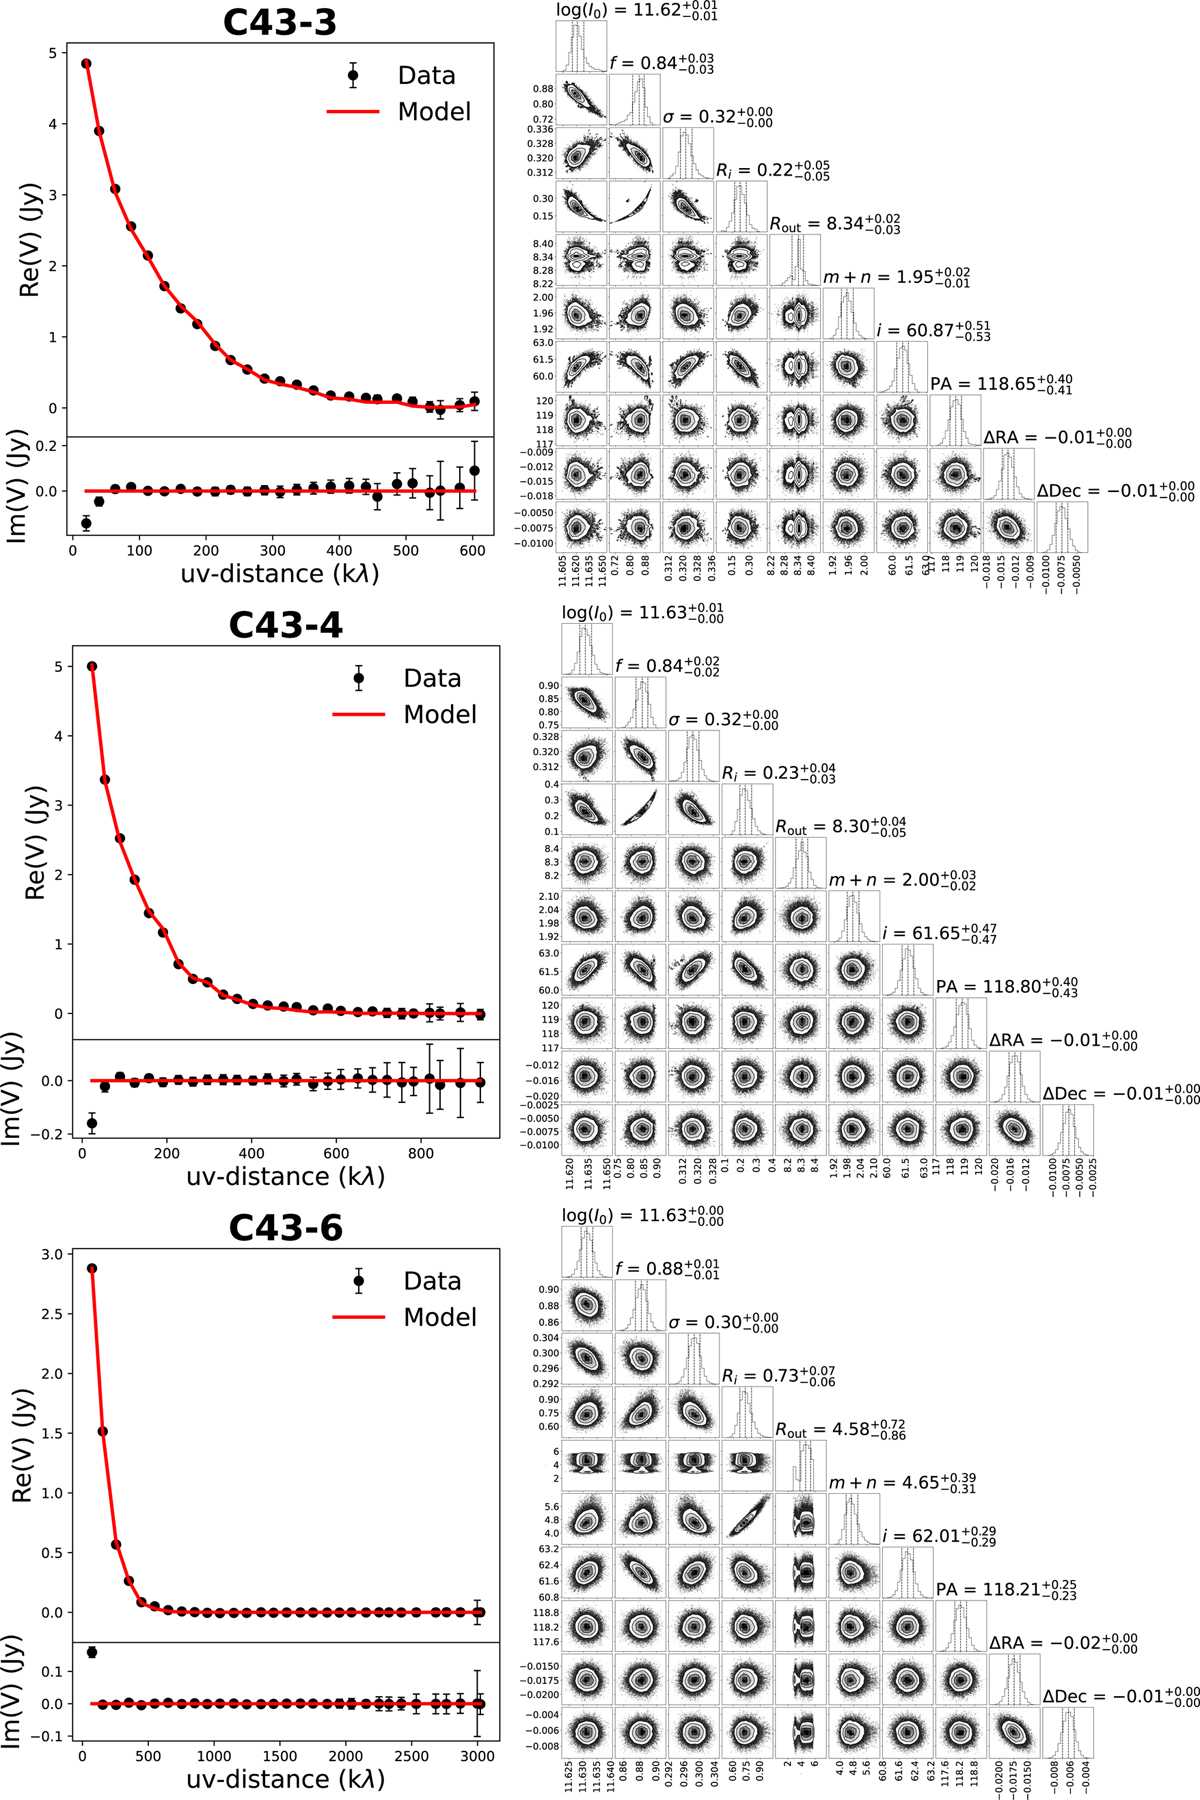
Fitting results from galario for the synthetic observations of the disk around sink 57, seen in the xy projection. Left: observed (black dots with error bars) and modelled (red curve) visibilities in real (top) and imaginary parts (lower panel) as a function of the baseline (in kλ) for three configurations C43-3 (upper), C43-4 (middle), and C43-6 (lower). Right: corner plots of the galario fittings of the visibility data with the disk and envelope model. The top sub-panels show the 1D histograms of the free parameters from the MCMC chains. The rest of the panels are the 2D histograms between each pair of parameters.
Current usage metrics show cumulative count of Article Views (full-text article views including HTML views, PDF and ePub downloads, according to the available data) and Abstracts Views on Vision4Press platform.
Data correspond to usage on the plateform after 2015. The current usage metrics is available 48-96 hours after online publication and is updated daily on week days.
Initial download of the metrics may take a while.