Fig. 2
Download original image
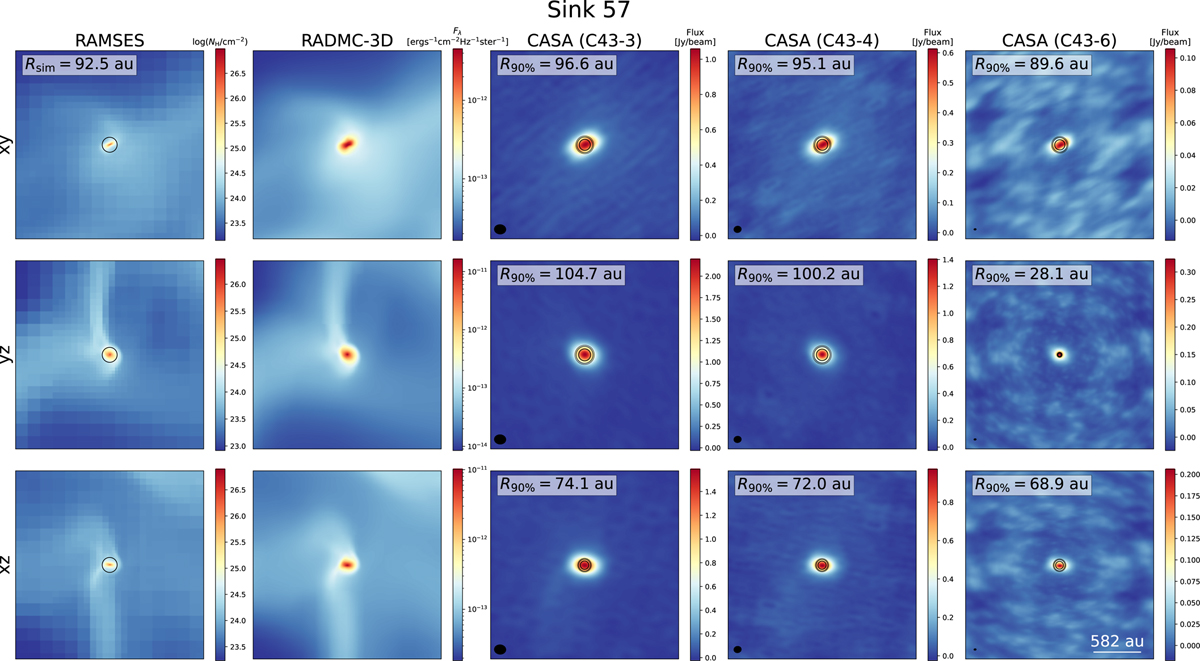
Images of the disk around sink 57 viewed in different projections and through different stages of the pipeline. From left to right: column density maps of the 1000 au region centred around the sink particle in 3 projections along the internal axes from the RAMSES simulation; continuum emission maps obtained with RADMC-3D of the same regions; and CASA images obtained with tclean from the C43-3, C43-4 and C43-6 visibilities. The disk sizes inferred from the gas kinematics, Rsim, and the modelled disk radii, R90%, (detailed in Sect. 6) are noted for each configuration and projection.
Current usage metrics show cumulative count of Article Views (full-text article views including HTML views, PDF and ePub downloads, according to the available data) and Abstracts Views on Vision4Press platform.
Data correspond to usage on the plateform after 2015. The current usage metrics is available 48-96 hours after online publication and is updated daily on week days.
Initial download of the metrics may take a while.