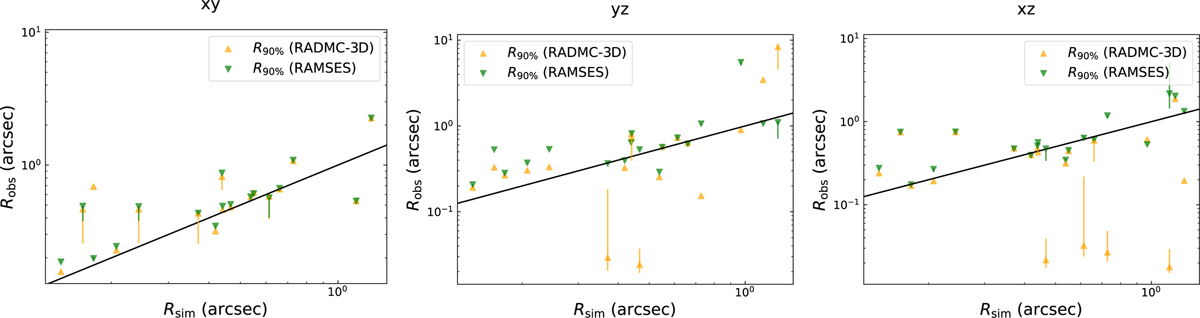
Fig. A.2
Download original image
Scatter plots for R90% extracted with the temperature profiles from RADMC-3D (green dots) and RAMSES (orange triangles) for all the single disks in one population versus the disk sizes extracted from the simulation. The results are similar in most cases, except notably for the disks where the central flux produced by RADMC-3D are modelled as the very narrow Gaussian.
Current usage metrics show cumulative count of Article Views (full-text article views including HTML views, PDF and ePub downloads, according to the available data) and Abstracts Views on Vision4Press platform.
Data correspond to usage on the plateform after 2015. The current usage metrics is available 48-96 hours after online publication and is updated daily on week days.
Initial download of the metrics may take a while.