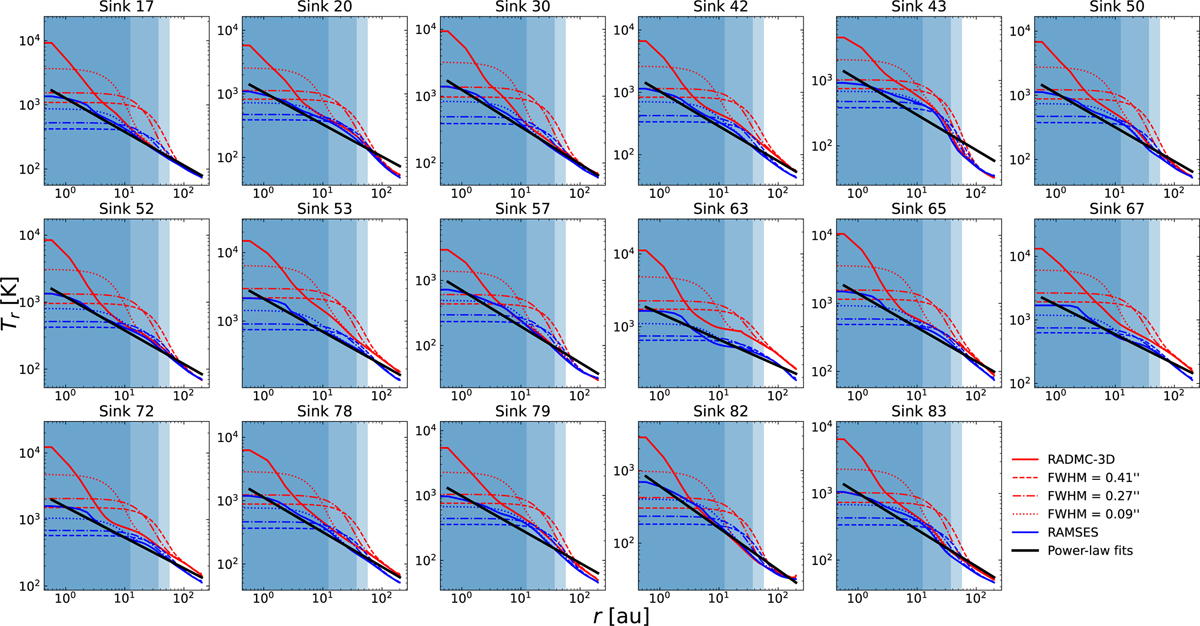
Fig. A.1
Download original image
Radial temperature profiles from RADMC-3D (red curves) and RAMSES (blue curves). The difference is more pronounced within the sink particle radius (r ≲ 4 au). Dashed, dotted, and dash-dotted lines shows the profiles smoothed by a Gaussian whose FWHM equal to that of the three antenna configurations in this study. The shaded areas marked the resolution limit corresponding to said configurations. The power-law fits to be used for the analytical calculations of the temperature are shown by the solid black line.
Current usage metrics show cumulative count of Article Views (full-text article views including HTML views, PDF and ePub downloads, according to the available data) and Abstracts Views on Vision4Press platform.
Data correspond to usage on the plateform after 2015. The current usage metrics is available 48-96 hours after online publication and is updated daily on week days.
Initial download of the metrics may take a while.