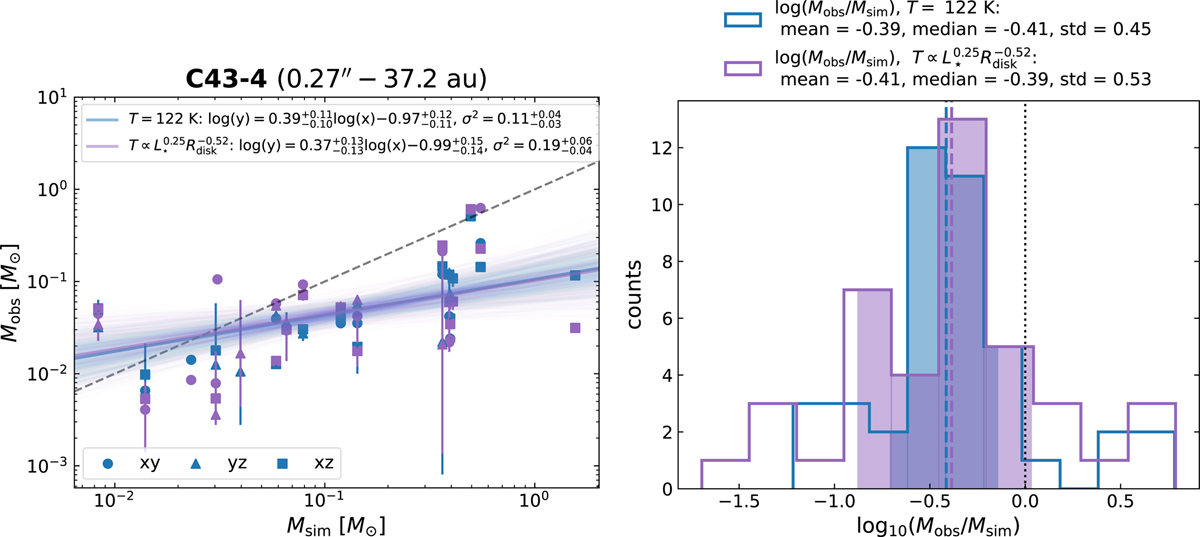
Fig. 11
Download original image
Scatter plots of the modelled disk masses using a constant dust temperature T = 123 K for all the disks (in blue) and a temperature scaling based on the disk radius Tdust(Rdisk) = 1122.76(Rdisk/1 au)−0.52 K (in purple) versus the masses inferred from the simulation (shown on the left). The log-linear fits to the data points with corresponding 1σ confidence intervals based on the 16th and 84 percentiles are plotted with the solid lines. Histograms of the Mobs/Msim ratios in logarithmic scale. Vertical dashed blue and purple lines indicate the medians of the ratio distributions (shown on the right).
Current usage metrics show cumulative count of Article Views (full-text article views including HTML views, PDF and ePub downloads, according to the available data) and Abstracts Views on Vision4Press platform.
Data correspond to usage on the plateform after 2015. The current usage metrics is available 48-96 hours after online publication and is updated daily on week days.
Initial download of the metrics may take a while.