Open Access
Fig. D.7
Download original image
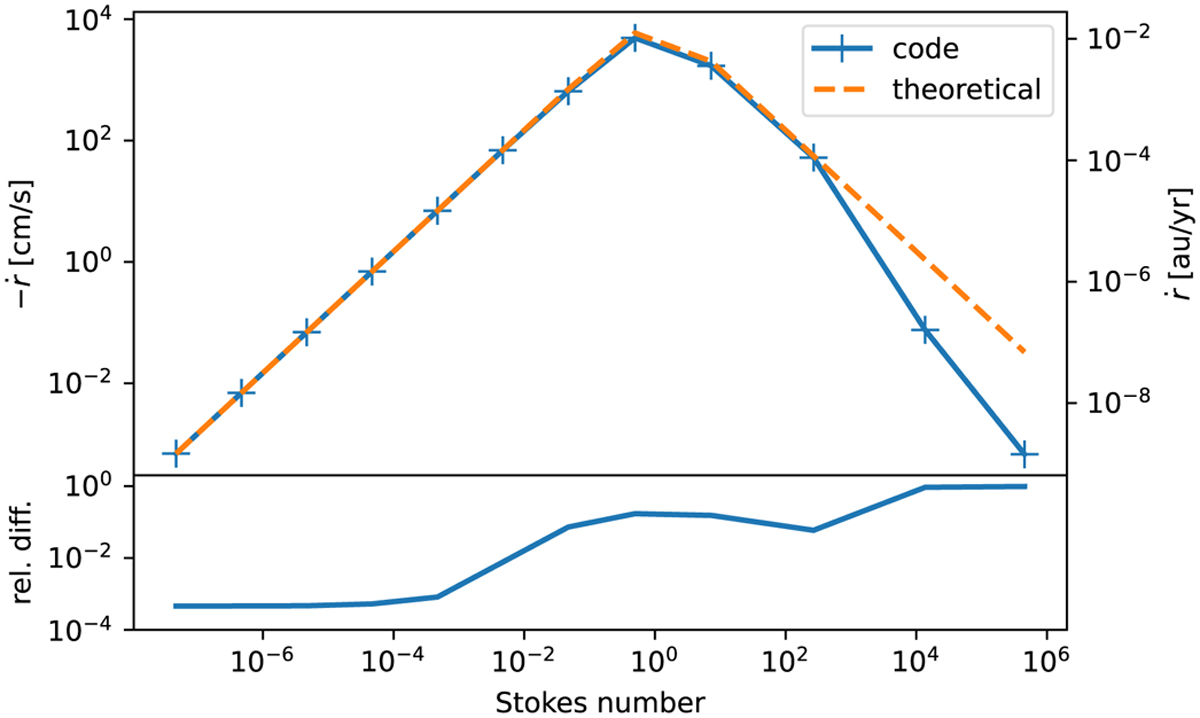
Results of the dust drift test. The top and bottom panel shows the value and deviation from the theoretical prediction of the drift speed as a function of the Stokes number, respectively. The large deviations for Stokes numbers around and larger than unity are due to oscillations in the integration. See Fig. D.8.
Current usage metrics show cumulative count of Article Views (full-text article views including HTML views, PDF and ePub downloads, according to the available data) and Abstracts Views on Vision4Press platform.
Data correspond to usage on the plateform after 2015. The current usage metrics is available 48-96 hours after online publication and is updated daily on week days.
Initial download of the metrics may take a while.