Fig. K.1
Download original image
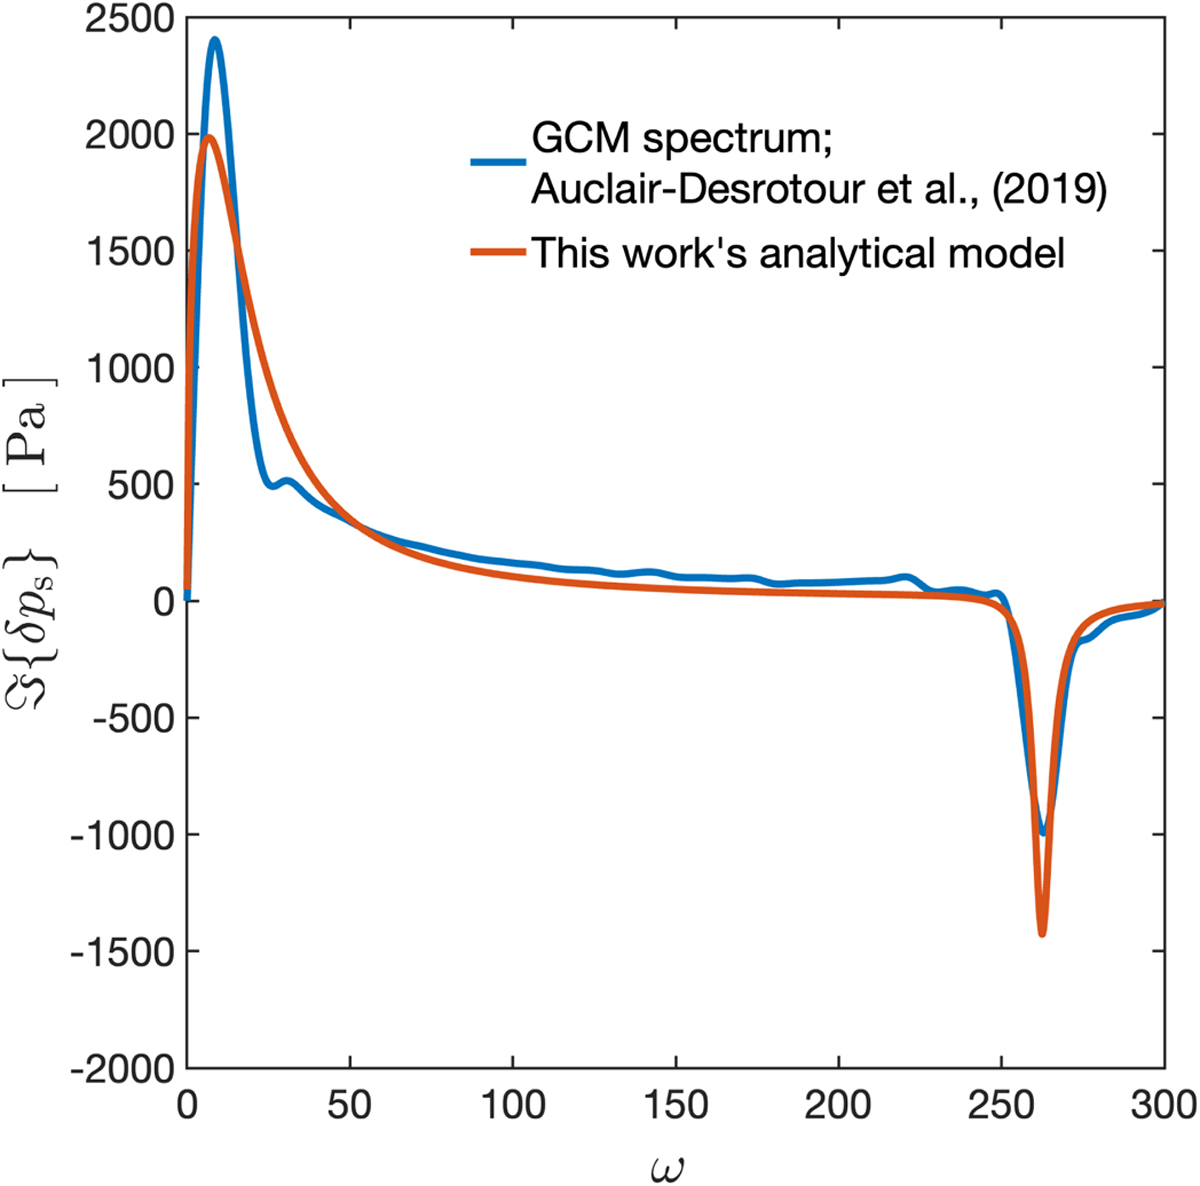
Similar to Figure 2, the tidal spectra, in terms of the imaginary part of the surface pressure anomaly, are plotted as a function of the normalized tidal frequency ω. The blue curve is that computed numerically in Auclair-Desrotour et al. (2019) using 3D GCM simulations, while the orange curve is recovered from our model by tuning the two free frequencies σbl and σ0 as discussed in Appendix K.
Current usage metrics show cumulative count of Article Views (full-text article views including HTML views, PDF and ePub downloads, according to the available data) and Abstracts Views on Vision4Press platform.
Data correspond to usage on the plateform after 2015. The current usage metrics is available 48-96 hours after online publication and is updated daily on week days.
Initial download of the metrics may take a while.