Fig. H.1
Download original image
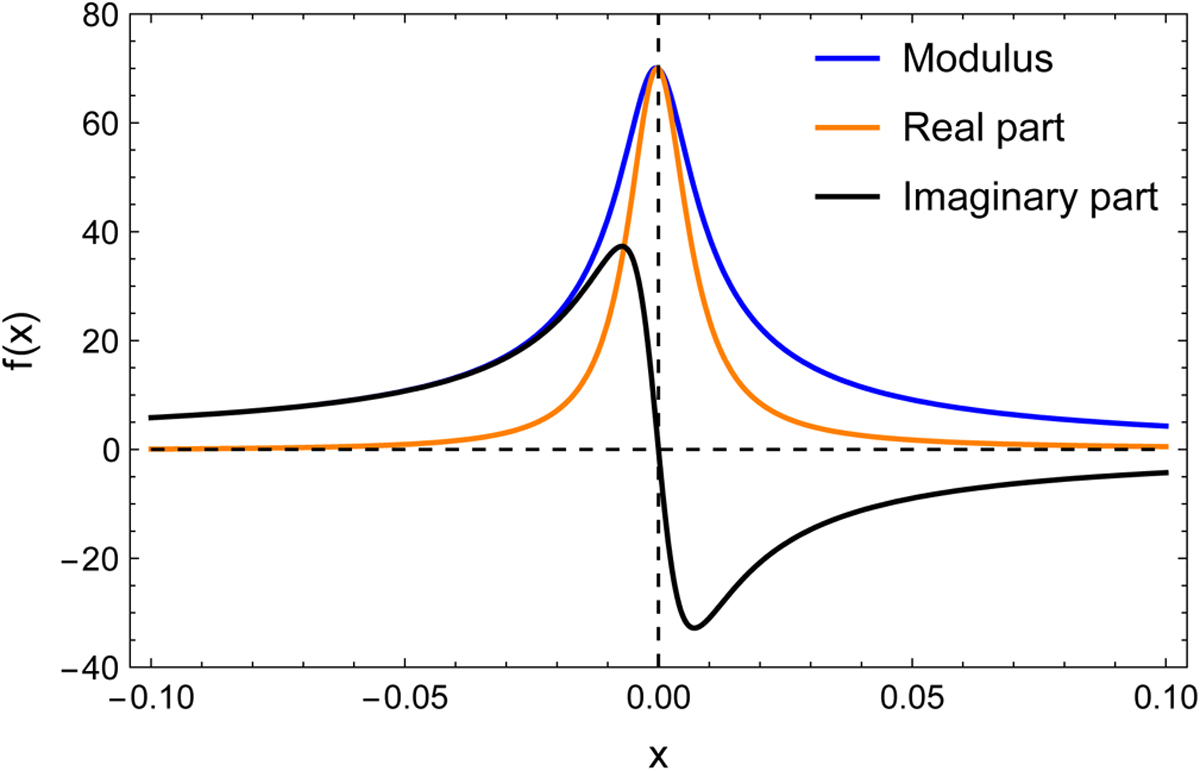
Sample of the tidal response, plotted in terms of the modulus, real part, and imaginary part of the surface pressure anomaly, all given by Eqs. (H.7). The function f(x) on the y-axis indicates the functional form of the pressure variation, that is, the pressure function divided by the constant factor K. The x-axis is centered at the position of the Lamb resonance. Notable is the difference in the resonant amplification of the response between the real part and the imaginary part.
Current usage metrics show cumulative count of Article Views (full-text article views including HTML views, PDF and ePub downloads, according to the available data) and Abstracts Views on Vision4Press platform.
Data correspond to usage on the plateform after 2015. The current usage metrics is available 48-96 hours after online publication and is updated daily on week days.
Initial download of the metrics may take a while.