Fig. 6
Download original image
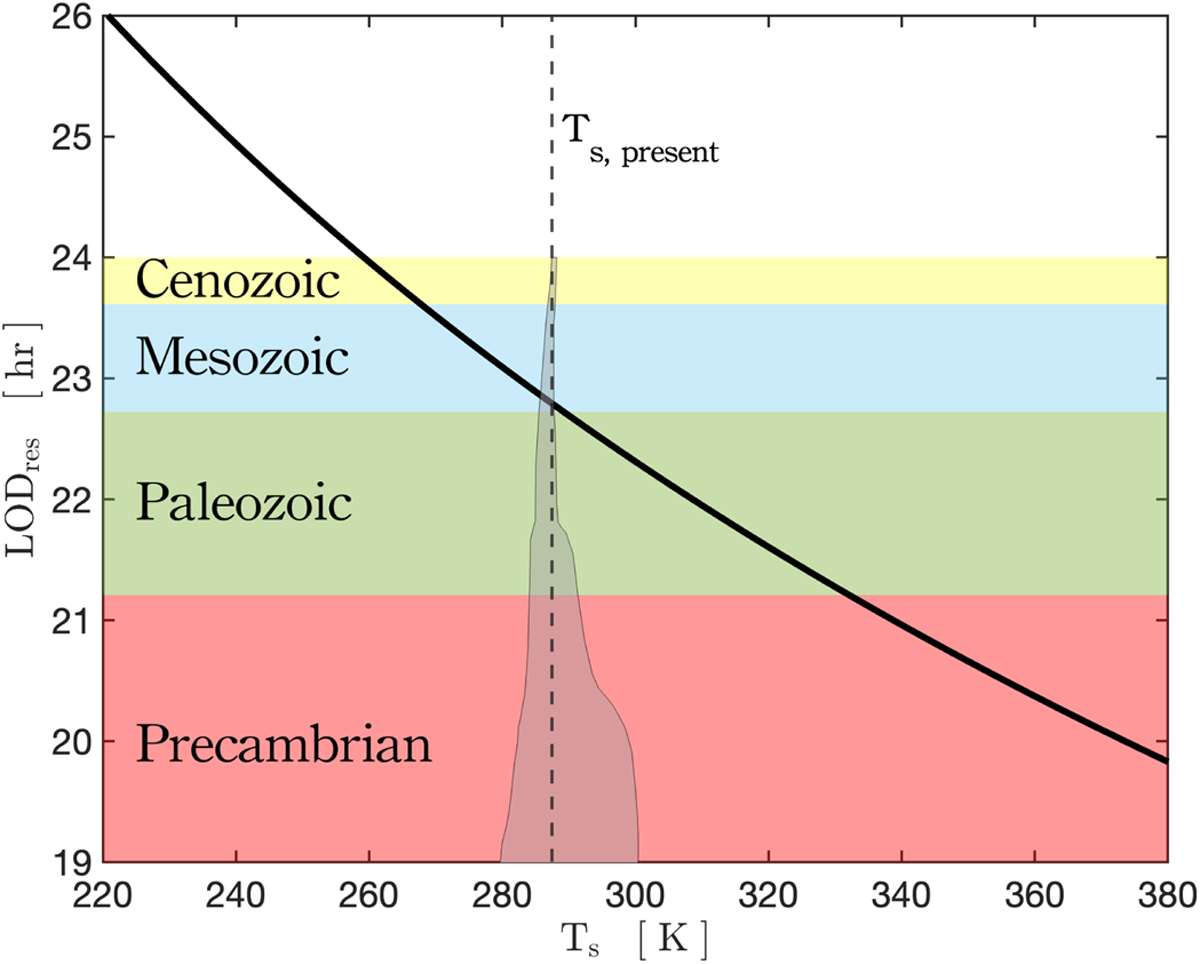
Dependence of the resonant rotational period on the mean surface temperature. By virtue of Eq. (24), the LOD at which the Lamb resonance occurs scales as the inverse square root of the mean surface temperature (solid curve). In Appendix I, we show that the same dependence holds if one considers a moist adiabatic profile. The shaded area of temperature variations highlights 95% confidence intervals for the past temperature evolution according to the carbon cycle model of Krissansen-Totton et al. (2018). The identified geological eras correspond to the LOD evolution model of Farhat et al. (2022). The overlap between the modeled temperature evolution and the black curve places the resonance occurrence in the late Paleozoic/early Mesozoic.
Current usage metrics show cumulative count of Article Views (full-text article views including HTML views, PDF and ePub downloads, according to the available data) and Abstracts Views on Vision4Press platform.
Data correspond to usage on the plateform after 2015. The current usage metrics is available 48-96 hours after online publication and is updated daily on week days.
Initial download of the metrics may take a while.