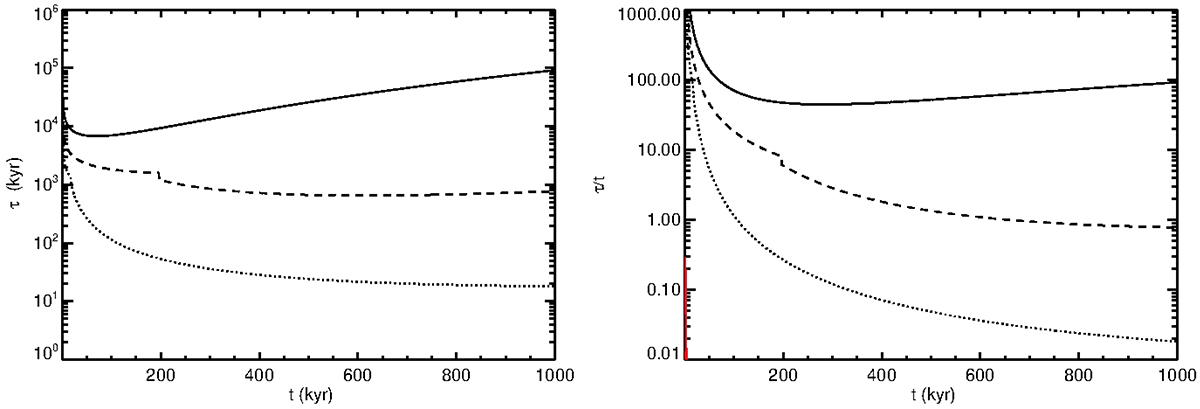
Fig. 4.
Download original image
Cooling times for the same cases given in Fig. 1 (left panel) and relative values with respect to the evolution times (right panel). Solid lines represent the powerful, 1046 erg s−1 case, dashed lines the 1044 erg s−1 case, and dotted lines the 1042 erg s−1. Calculations are shown for the shocked hot, dilute ISM described by Eq. (7).
Current usage metrics show cumulative count of Article Views (full-text article views including HTML views, PDF and ePub downloads, according to the available data) and Abstracts Views on Vision4Press platform.
Data correspond to usage on the plateform after 2015. The current usage metrics is available 48-96 hours after online publication and is updated daily on week days.
Initial download of the metrics may take a while.