Fig. 9
Download original image
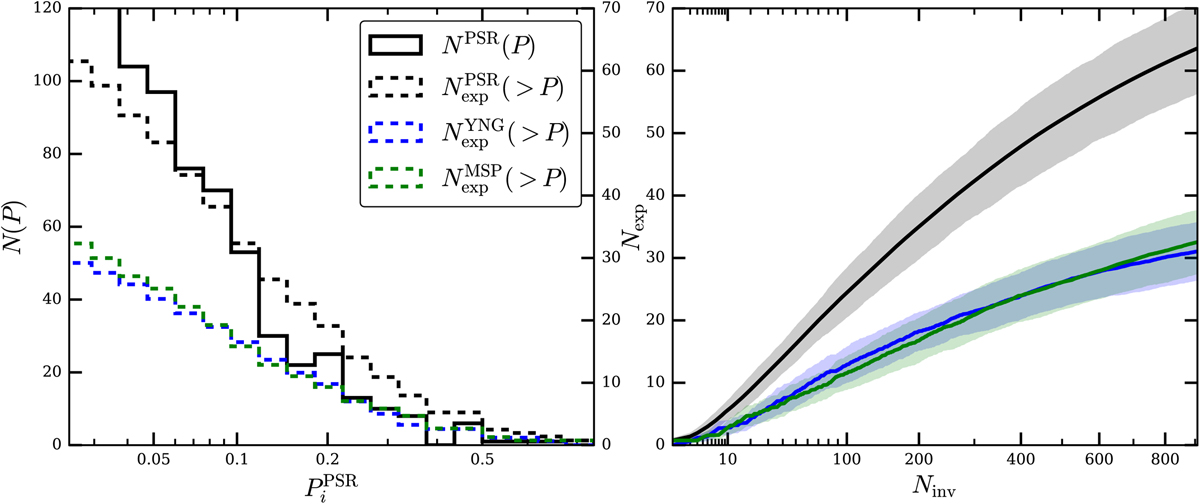
Overview of match probabilities. The left panel shows a histogram of pulsar−match probabilities ![]() (black, solid line) and the expected number of pulsar detections Nexp above a certain threshold of
(black, solid line) and the expected number of pulsar detections Nexp above a certain threshold of ![]() (black, dashed), after visual inspection. The green and blue dashed lines indicate the expected numbers of young pulsars and MSPs above the respective threshold. The right panel shows the dependence of the expected number of detections with the number of investigated X-ray sources Ninv for all pulsars and the two subsets in green and blue. The shaded regions indicate the expected statistical error on the predicted number.
(black, dashed), after visual inspection. The green and blue dashed lines indicate the expected numbers of young pulsars and MSPs above the respective threshold. The right panel shows the dependence of the expected number of detections with the number of investigated X-ray sources Ninv for all pulsars and the two subsets in green and blue. The shaded regions indicate the expected statistical error on the predicted number.
Current usage metrics show cumulative count of Article Views (full-text article views including HTML views, PDF and ePub downloads, according to the available data) and Abstracts Views on Vision4Press platform.
Data correspond to usage on the plateform after 2015. The current usage metrics is available 48-96 hours after online publication and is updated daily on week days.
Initial download of the metrics may take a while.