Fig. 8
Download original image
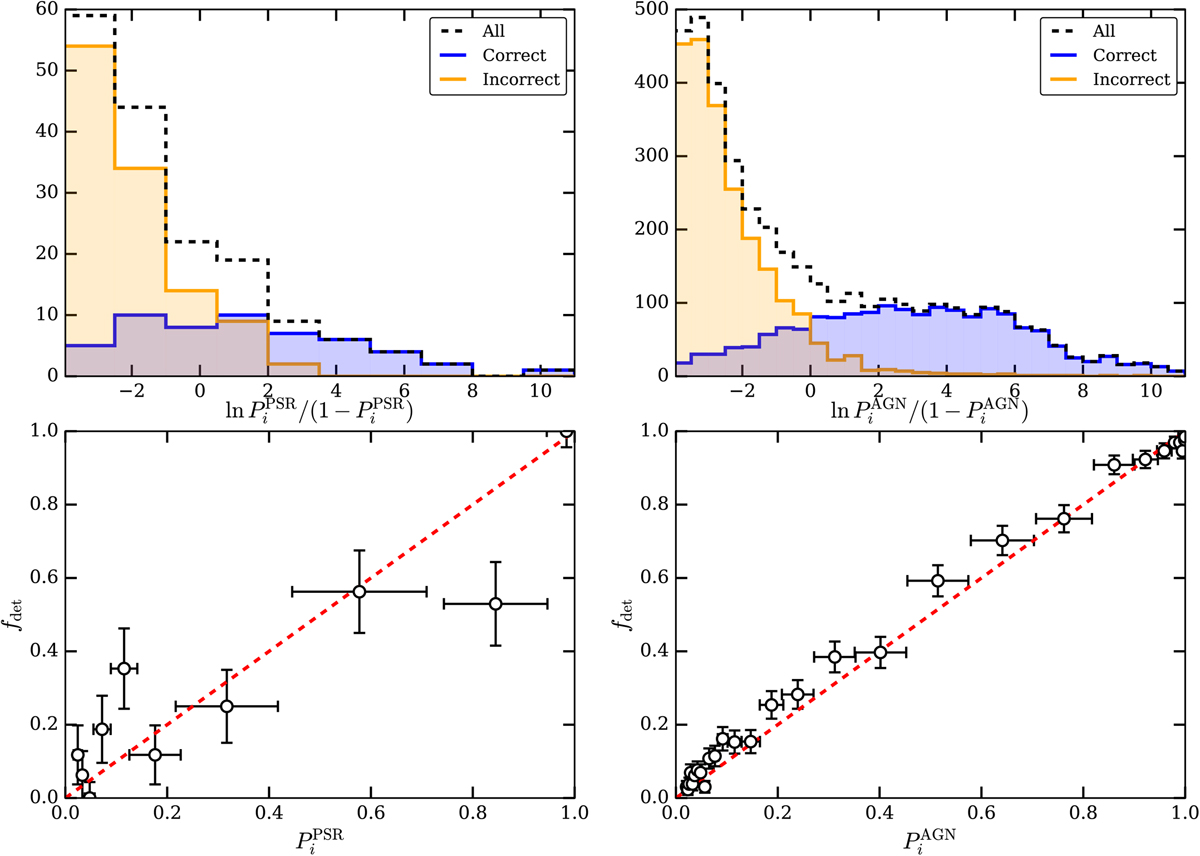
Verification of match probabilities. The top panels indicate the distribution of match probabilities ![]() (left/right) for associated 4FGL sources. The blue (orange) histograms indicate the match probabilities assigned to sources known to be the correct (incorrect) counterparts of the given 4FGL source, with the black dashed line indicating the sum of the two distributions. The lower panels show calibration curves for the two classes, plotting the observed fraction of correctly detected counterparts ƒdet, for sources binned by predicted match probability
(left/right) for associated 4FGL sources. The blue (orange) histograms indicate the match probabilities assigned to sources known to be the correct (incorrect) counterparts of the given 4FGL source, with the black dashed line indicating the sum of the two distributions. The lower panels show calibration curves for the two classes, plotting the observed fraction of correctly detected counterparts ƒdet, for sources binned by predicted match probability ![]() . The red line indicates the 1 : 1 relation expected for an ideal, unbiased classifier.
. The red line indicates the 1 : 1 relation expected for an ideal, unbiased classifier.
Current usage metrics show cumulative count of Article Views (full-text article views including HTML views, PDF and ePub downloads, according to the available data) and Abstracts Views on Vision4Press platform.
Data correspond to usage on the plateform after 2015. The current usage metrics is available 48-96 hours after online publication and is updated daily on week days.
Initial download of the metrics may take a while.