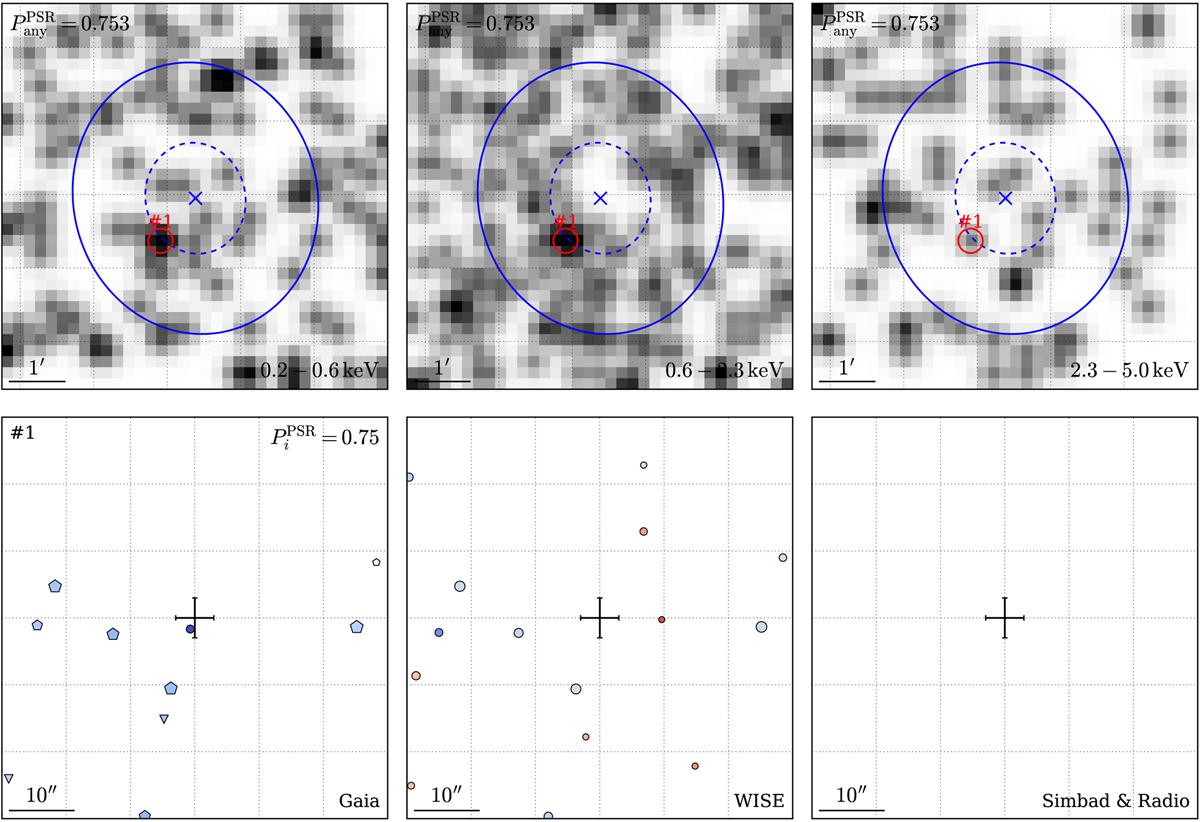
Fig. 7
Download original image
Example diagnostic plot for visual inspection. The top panels display eRASS:4 images of the position of the source 4FGL J1544.2−2554 in the energy bands 0.2–0.6, 0.6–2.3, and 2.3–5.0 keV, overlaid with the 1σ (blue dashed line) and 95% error ellipse of the 4FGL source (blue solid line), and the position of the detected X-ray source (red). The pixel size is 12″. The bottom panels show the local distribution of Gaia DR3 (left), CatWISE2020 (center), as well as SIMBAD entries and radio sources (right) around the X-ray source position (error bars). In the left and center panels, the size of the markers is proportional to the source brightness, and their color reflects the photometric colors (with bluer markers indicating bluer colors). In the left panel, pentagonal (triangular) markers correspond to sources with statistically significant (insignificant) proper motion or parallax, circular markers indicate the lack of a complete astrometric solution for a source.
Current usage metrics show cumulative count of Article Views (full-text article views including HTML views, PDF and ePub downloads, according to the available data) and Abstracts Views on Vision4Press platform.
Data correspond to usage on the plateform after 2015. The current usage metrics is available 48-96 hours after online publication and is updated daily on week days.
Initial download of the metrics may take a while.