Fig. 6
Download original image
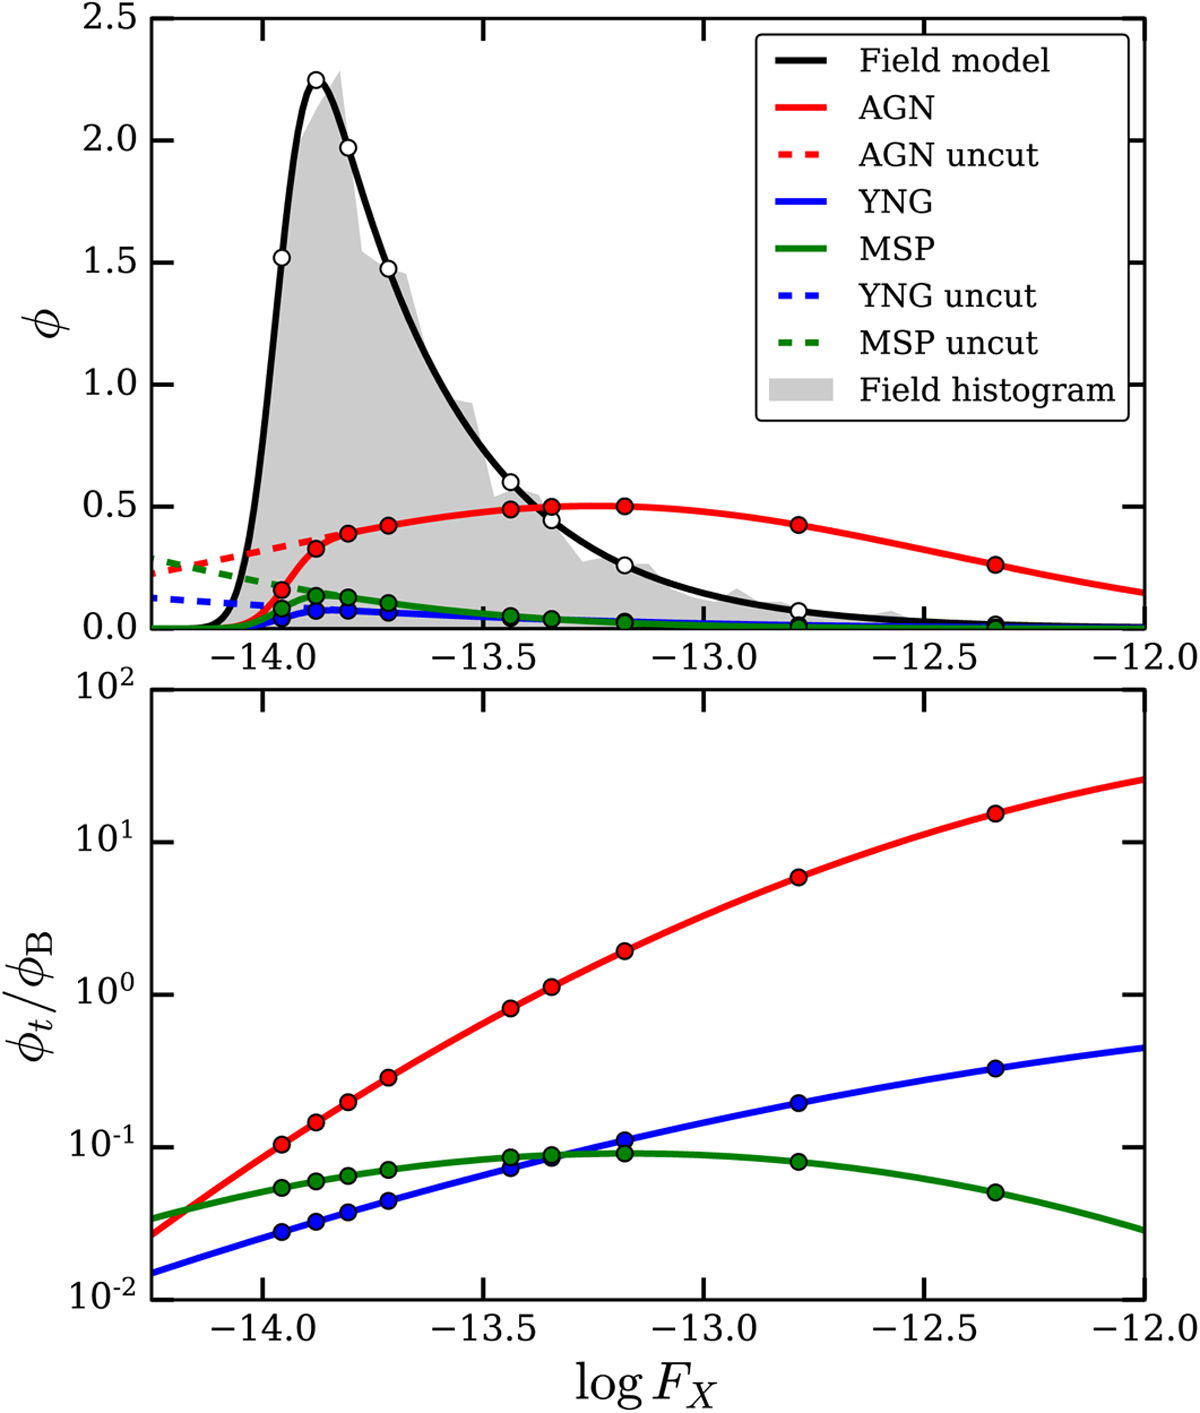
Example for the computation of the expected X-ray flux for a specific γ-ray source, 4FGL J0159.8–2234. The top panel indicates the normalized X-ray flux distributions of field sources (black), and for the assumption of a young pulsar, MSP, or AGN nature. The bottom panel depicts the corresponding ratio of probabilities. The markers indicate the fluxes of the detected X-ray sources around the Fermi source. For reference, the γ-ray flux of the source is log Fγ = −12.00, and the limiting X-ray flux is λ = −13.95.
Current usage metrics show cumulative count of Article Views (full-text article views including HTML views, PDF and ePub downloads, according to the available data) and Abstracts Views on Vision4Press platform.
Data correspond to usage on the plateform after 2015. The current usage metrics is available 48-96 hours after online publication and is updated daily on week days.
Initial download of the metrics may take a while.