Fig. A.2
Download original image
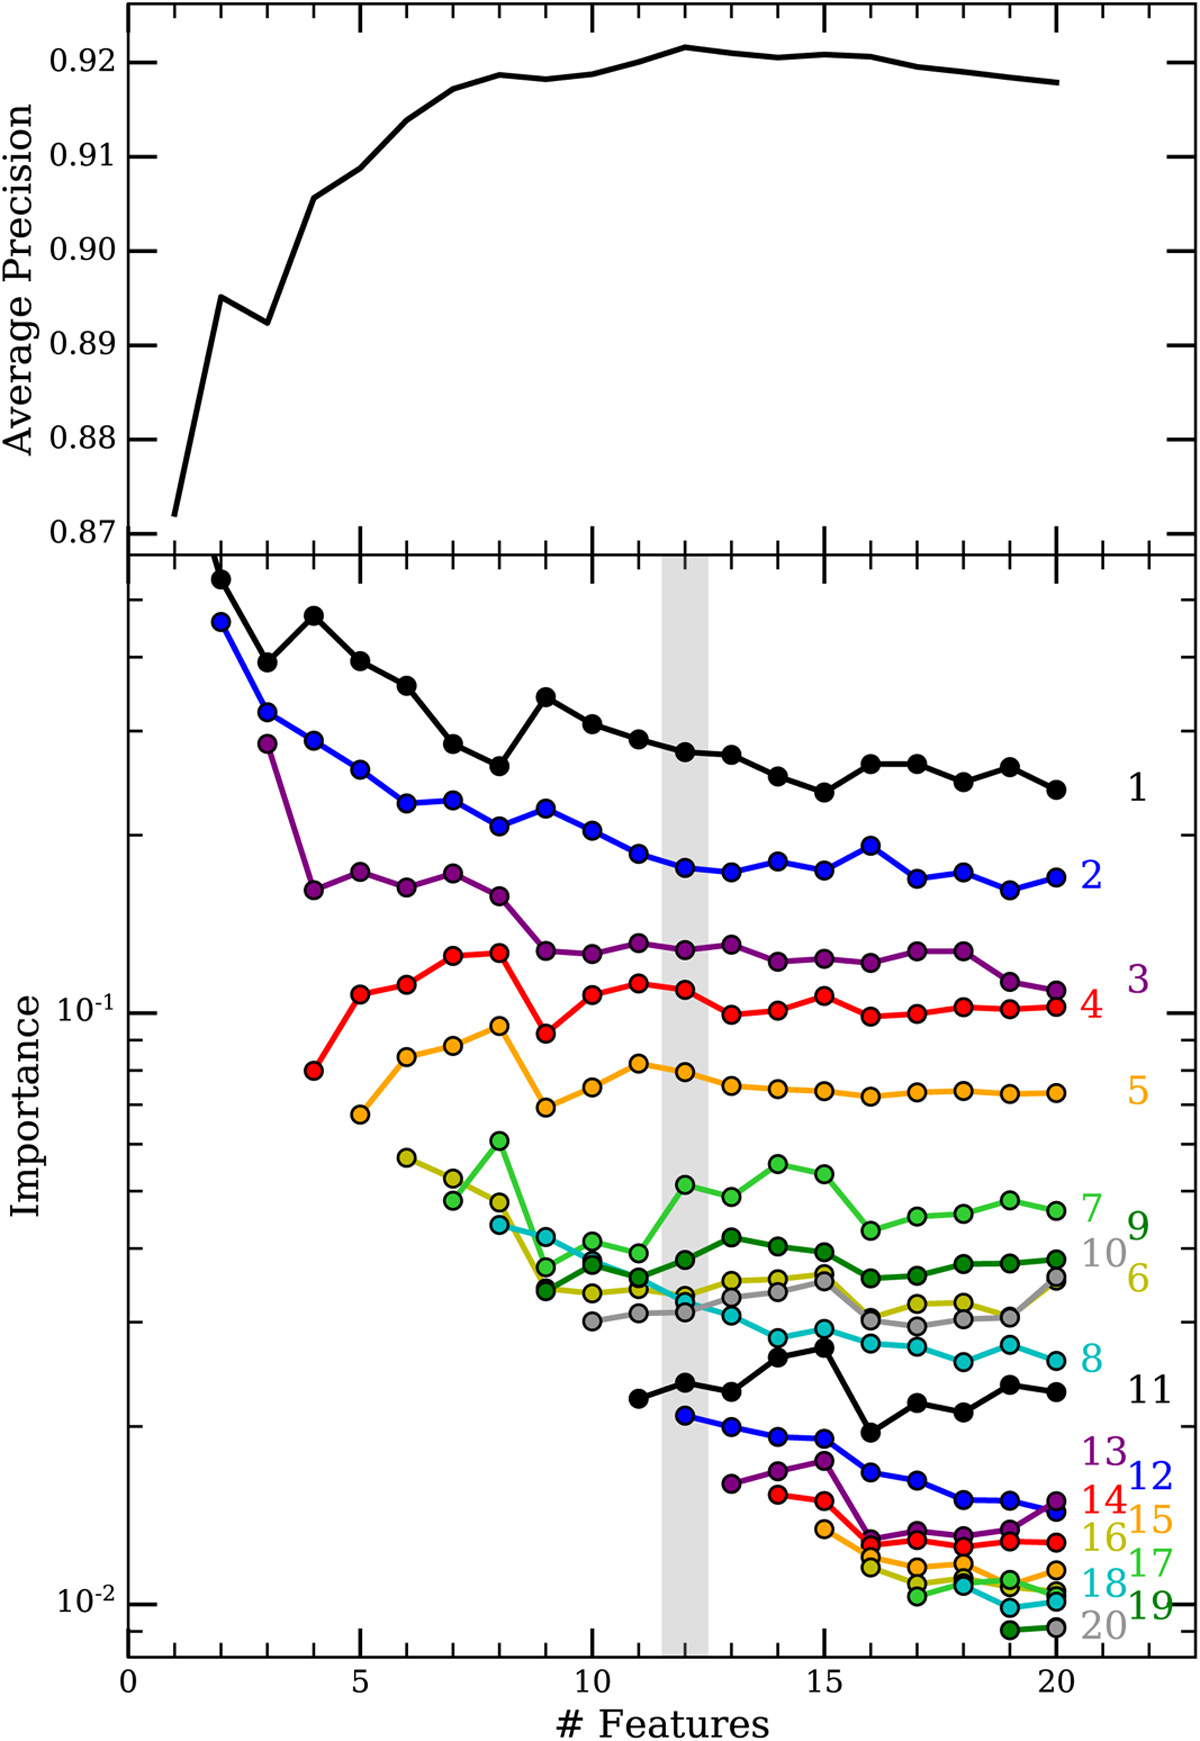
Illustration of recursive feature elimination. The top panel illustrates the evolution of the average precision of our classifier with the number of features. The bottom panel illustrates the evolution of the importance of individual features, as the least important feature is recursively removed. The shaded bar indicates the set of features we found to be optimal.
The curves indicate the parameters numbered by their reverse order of elimination: (1) SigCombined, (2) ModSigCurv, (3) LP_beta, (4) LP_SigCurv, (5) K24, (6) SymLat, (7) Frac_Variability, (8) EFluxErr, (9) HR34, (10) Variability_Index, (11) HR45, (12) PL_Index, (13) HR 12, (14) DeltaInd, (15) SymLon, (16) K13, (17) Pivot_Energy, (18) LP_Index, (19) K35, (20) HR23.
Current usage metrics show cumulative count of Article Views (full-text article views including HTML views, PDF and ePub downloads, according to the available data) and Abstracts Views on Vision4Press platform.
Data correspond to usage on the plateform after 2015. The current usage metrics is available 48-96 hours after online publication and is updated daily on week days.
Initial download of the metrics may take a while.