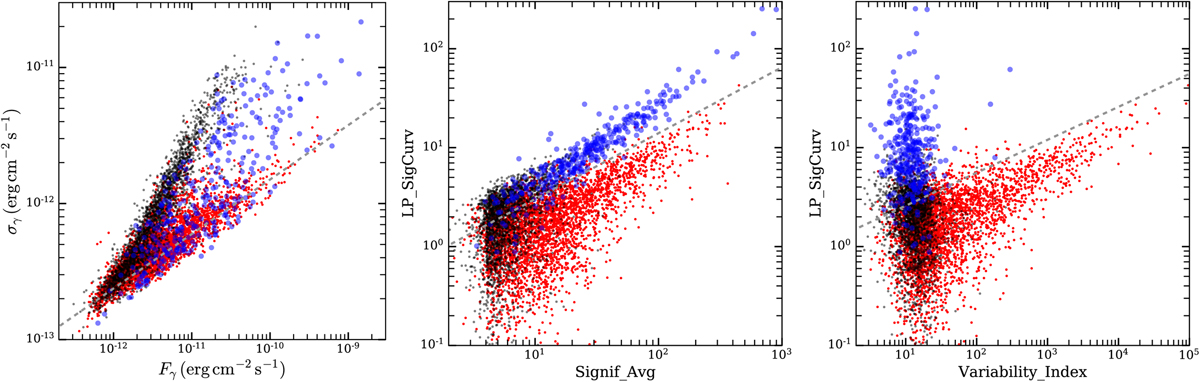
Fig. A.1
Download original image
Distribution of 4FGL-DR4 sources in feature space. In each panel, we show the distribution of pulsars (blue), blazars (red), and unassociated sources (black) in different parameters. The left panel compares the observed energy flux Fγ in the 100 MeV – 100 GeV band to its estimated error σγ. The central panel compares the significance of detection with that of spectral curvature for a log-parabola model. In the right panel, this is compared with the measure of variability on monthly to yearly scales. In each panel, the dashed gray line indicates the direction perpendicular to which we defined our composite parameters to be able to better separate the source types.
Current usage metrics show cumulative count of Article Views (full-text article views including HTML views, PDF and ePub downloads, according to the available data) and Abstracts Views on Vision4Press platform.
Data correspond to usage on the plateform after 2015. The current usage metrics is available 48-96 hours after online publication and is updated daily on week days.
Initial download of the metrics may take a while.