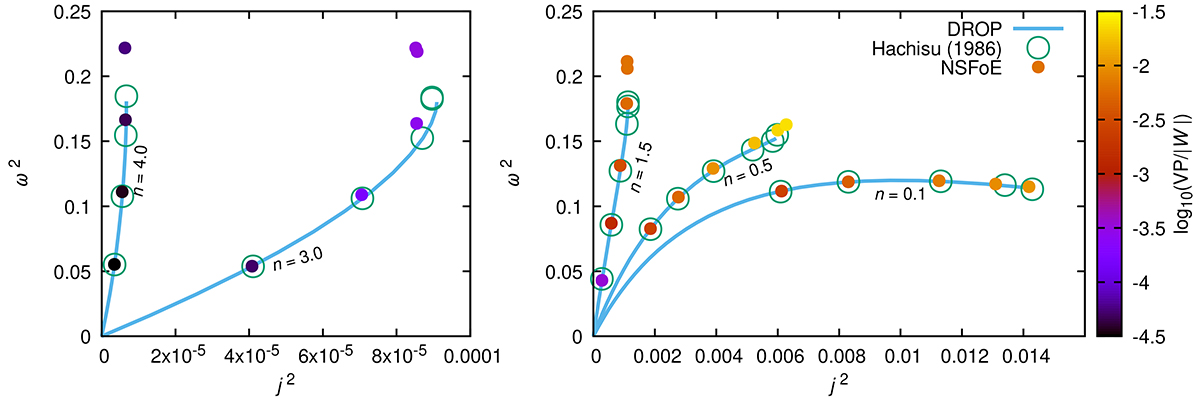
Fig. 8.
Download original image
The (j2, ω2) diagram for several polytropic indices n labeled on the curves. The solid lines correspond to the solutions obtained from DROP code. The empty circles are the solutions reported in the tables of Hachisu (1986a). The full circles are the solutions obtained with the SCF method with dimension reduction. The color-coding indicates the decimal logarithm of the relative virial parameter |VP/W|.
Current usage metrics show cumulative count of Article Views (full-text article views including HTML views, PDF and ePub downloads, according to the available data) and Abstracts Views on Vision4Press platform.
Data correspond to usage on the plateform after 2015. The current usage metrics is available 48-96 hours after online publication and is updated daily on week days.
Initial download of the metrics may take a while.