Fig. 8
Download original image
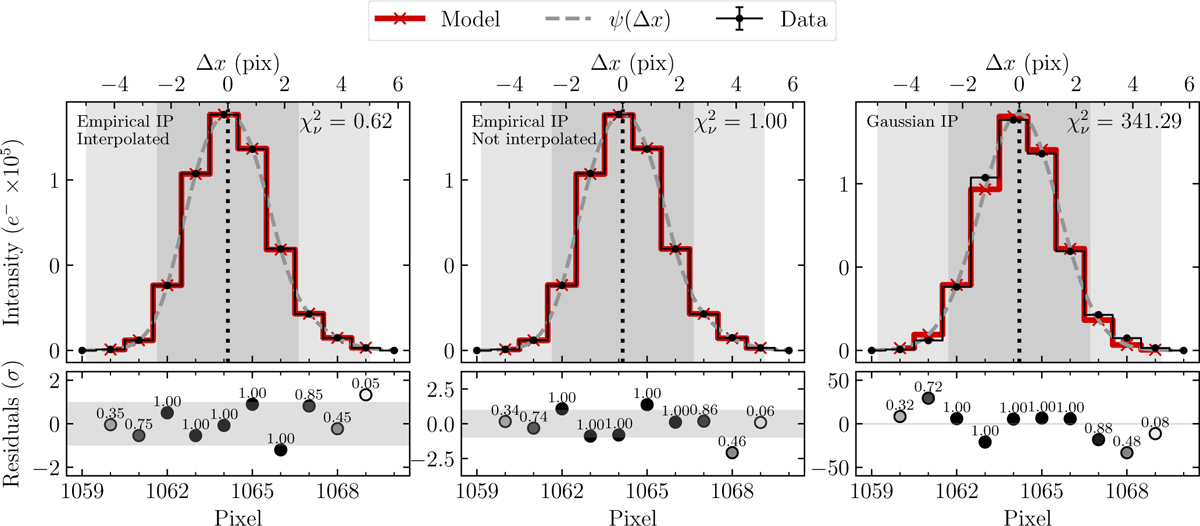
Results of fitting the same astrocomb line using three different IPs. They are, in order from left to right, (1) the most likely empirical IP, allowed to vary locally within the echelle order (interpolated), (2) when the empirical IP from the nearest segment is used instead (not interpolated), and (3) the Gaussian IP. In each top panel, the solid black histogram with error bars shows the astrocomb line flux and the solid red line with crosses shows the best fit model of that data. The line model is described by Eq. (13) when fitting the empirical IP and by Eq. (12) when fitting a Gaussian IP. The location of the best-fit line centre, x*, is indicated by the vertical dotted black line in each panel, with the ticks and labels on the top indicating Δx. The two vertical grey shaded bands illustrate the limits of the weighting scheme, Eq. (16). ![]() for each fit is printed in the top right corner of the panel. In calculating
for each fit is printed in the top right corner of the panel. In calculating ![]() , no data weighting was applied. Finally, the continuous dashed grey line shows the IP model, ψ, shifted and rescaled to match the data (for visual comparison purposes only). Dots in each bottom panel are the normalised fit residuals and the grey shaded band indicates the ±lσ region. Dot opacity is proportional to the pixel weight in the fit (Eq. (16)), which is also printed above each dot. Dots falling within the darker grey band in the top panel all had a weight of unity, whereas the dots falling outside of both bands had zero weight (so are not plotted). Dots falling in between, that is inside the lighter grey band of the top panel, had weights that change linearly between zero and unity. We note that the y-axis scale differs between the bottom panels.
, no data weighting was applied. Finally, the continuous dashed grey line shows the IP model, ψ, shifted and rescaled to match the data (for visual comparison purposes only). Dots in each bottom panel are the normalised fit residuals and the grey shaded band indicates the ±lσ region. Dot opacity is proportional to the pixel weight in the fit (Eq. (16)), which is also printed above each dot. Dots falling within the darker grey band in the top panel all had a weight of unity, whereas the dots falling outside of both bands had zero weight (so are not plotted). Dots falling in between, that is inside the lighter grey band of the top panel, had weights that change linearly between zero and unity. We note that the y-axis scale differs between the bottom panels.
Current usage metrics show cumulative count of Article Views (full-text article views including HTML views, PDF and ePub downloads, according to the available data) and Abstracts Views on Vision4Press platform.
Data correspond to usage on the plateform after 2015. The current usage metrics is available 48-96 hours after online publication and is updated daily on week days.
Initial download of the metrics may take a while.