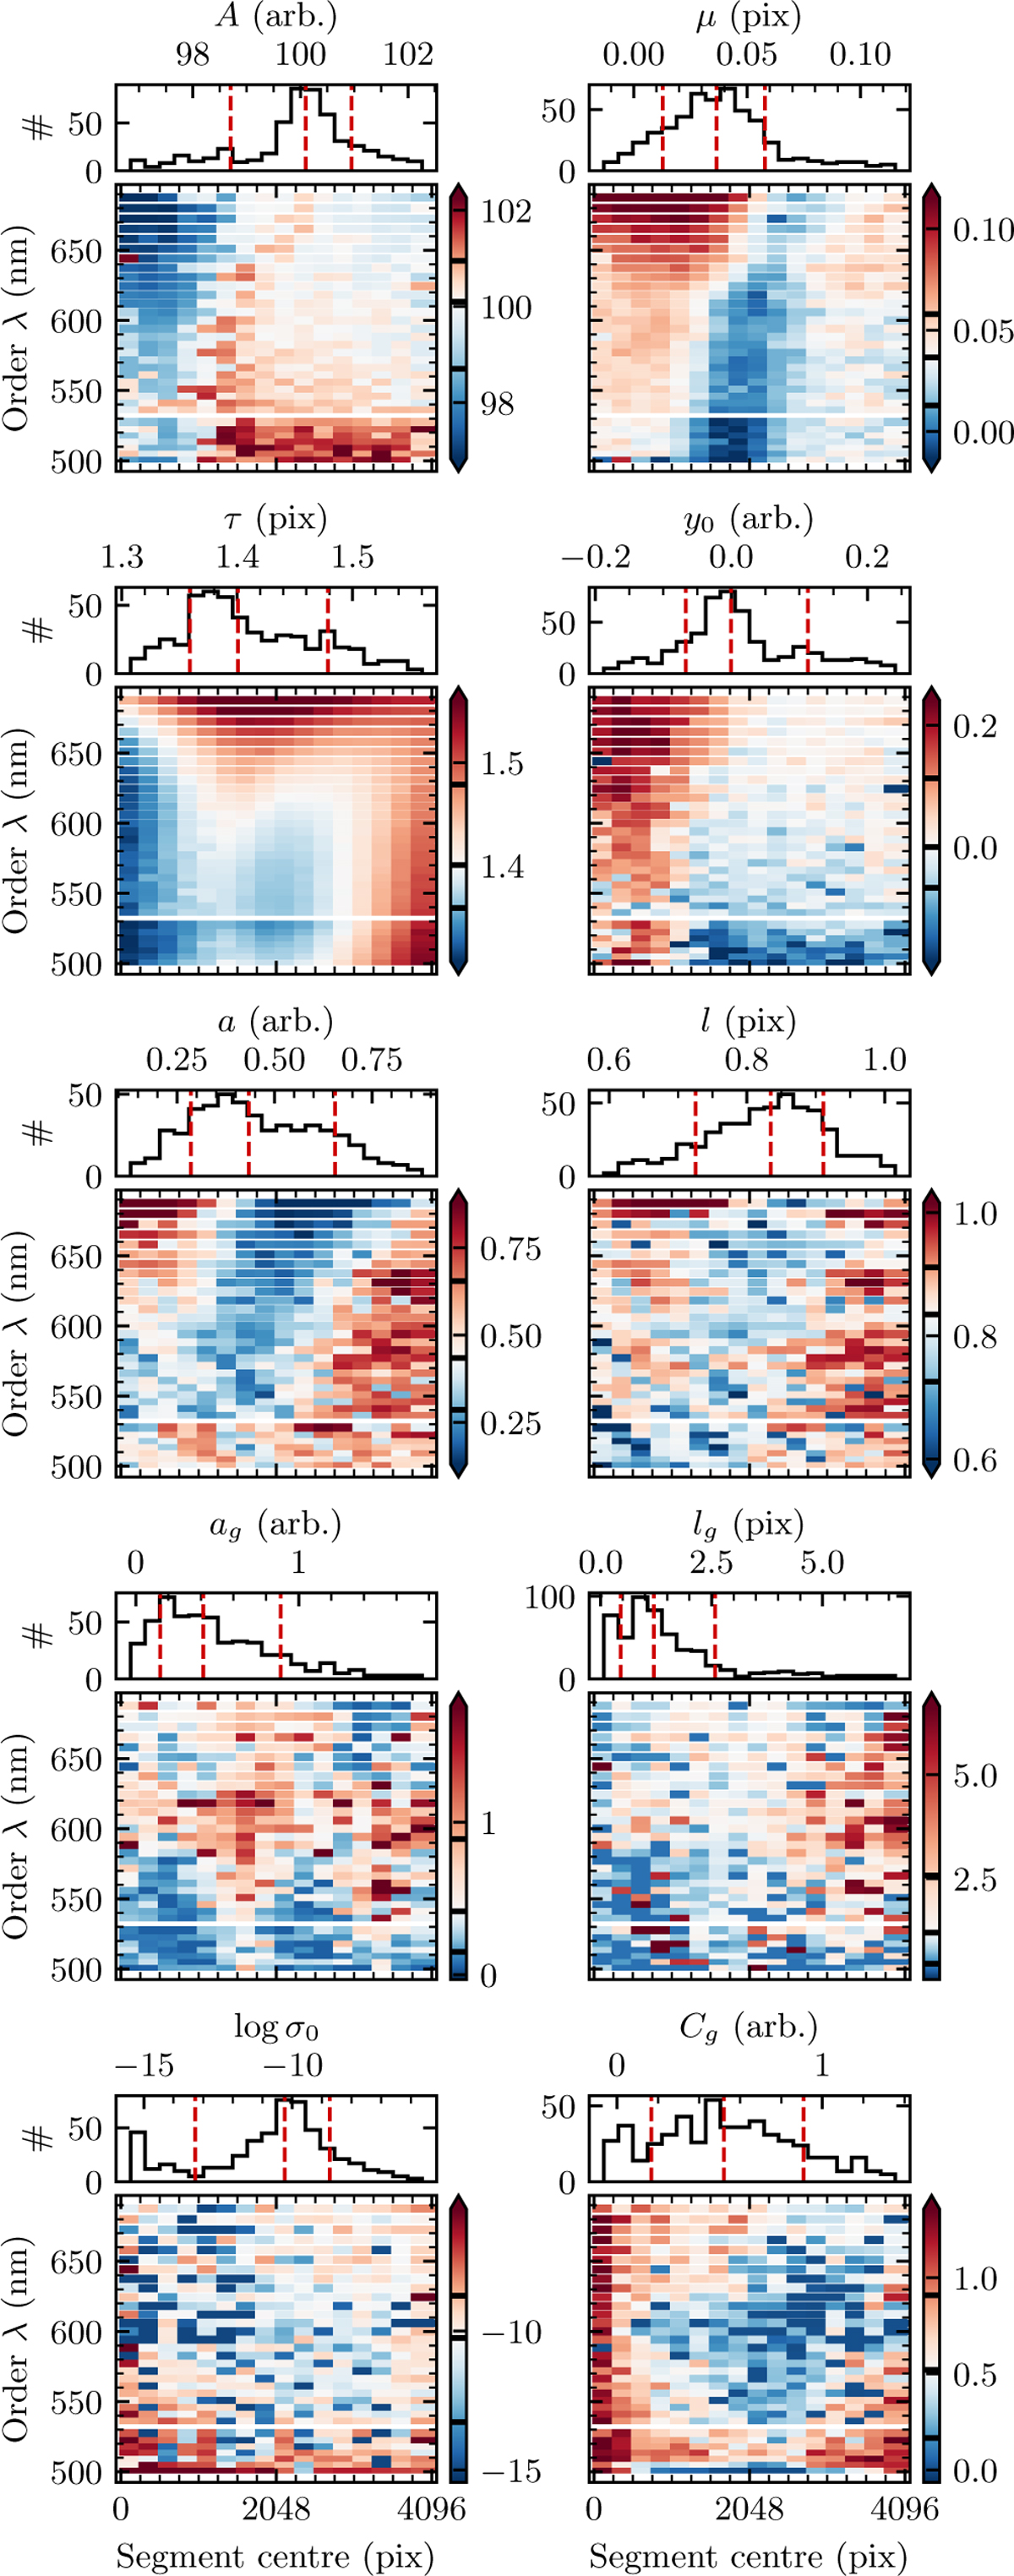
Fig. 7
Download original image
Values of hyperparameters describing ψ as a function of detector position, also plotted as histograms above the main panels. White colour in the main panels corresponds to the median hyperparameter value. To better visualise trends, the colour bar and histogram limits only show the central 95% of the plotted values. The units on the colour bar are indicated above the panels. The vertical dashed red lines showing the median and the central 68% limits (calculated over all values) which are also shown as thick black lines in the colour bar.
Current usage metrics show cumulative count of Article Views (full-text article views including HTML views, PDF and ePub downloads, according to the available data) and Abstracts Views on Vision4Press platform.
Data correspond to usage on the plateform after 2015. The current usage metrics is available 48-96 hours after online publication and is updated daily on week days.
Initial download of the metrics may take a while.