Fig. 5
Download original image
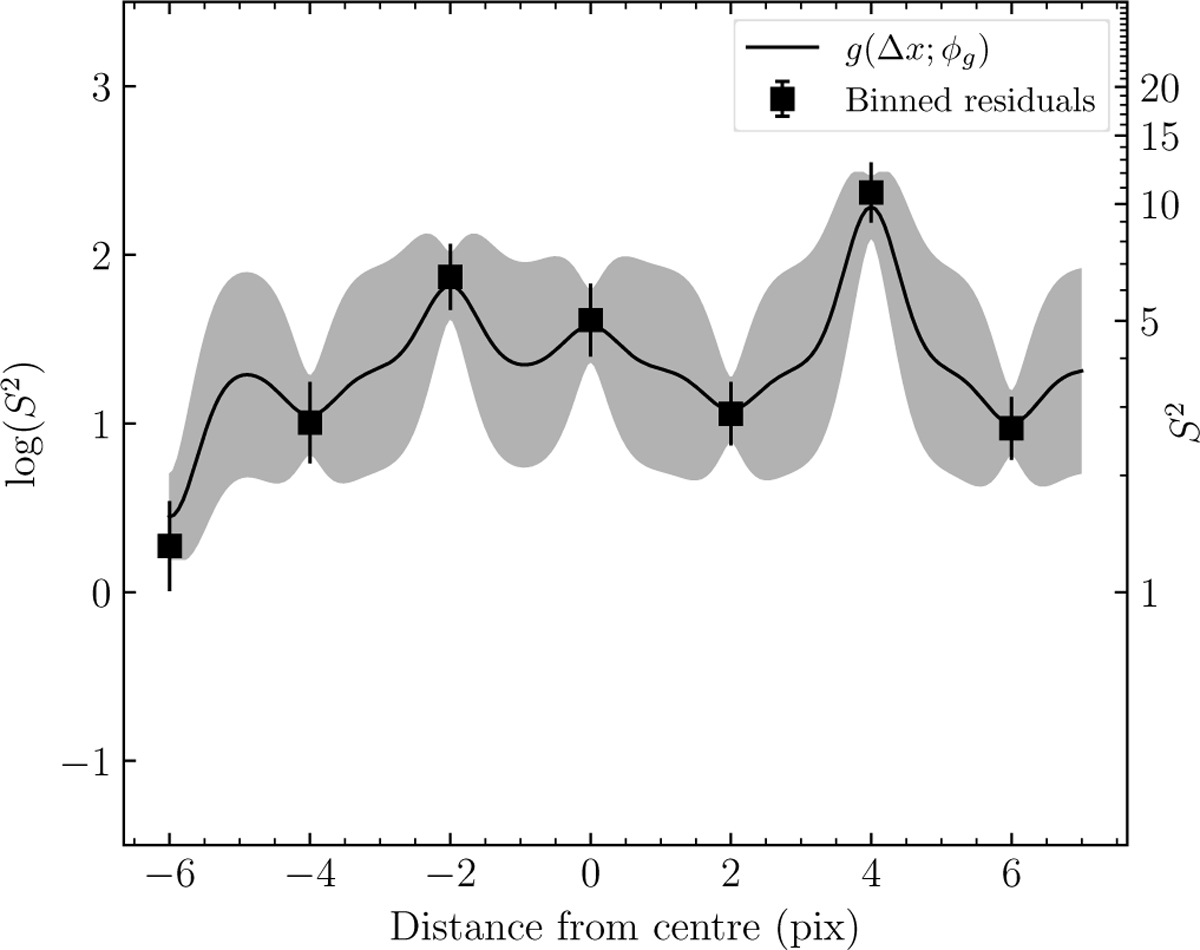
GP for empirical variance estimation. g(∆x) multiplies ![]() to capture the observational variances more correctly. Black squares with error bars are the logarithms of S2, where S2 is calculated as explained in the text. The solid black line is the mean prediction of g(∆x) from GP regression and the grey shaded are the lσ ranges. The y-axis label on the right shows S2 and g(∆x) on a linear scale.
to capture the observational variances more correctly. Black squares with error bars are the logarithms of S2, where S2 is calculated as explained in the text. The solid black line is the mean prediction of g(∆x) from GP regression and the grey shaded are the lσ ranges. The y-axis label on the right shows S2 and g(∆x) on a linear scale.
Current usage metrics show cumulative count of Article Views (full-text article views including HTML views, PDF and ePub downloads, according to the available data) and Abstracts Views on Vision4Press platform.
Data correspond to usage on the plateform after 2015. The current usage metrics is available 48-96 hours after online publication and is updated daily on week days.
Initial download of the metrics may take a while.