Fig. 4
Download original image
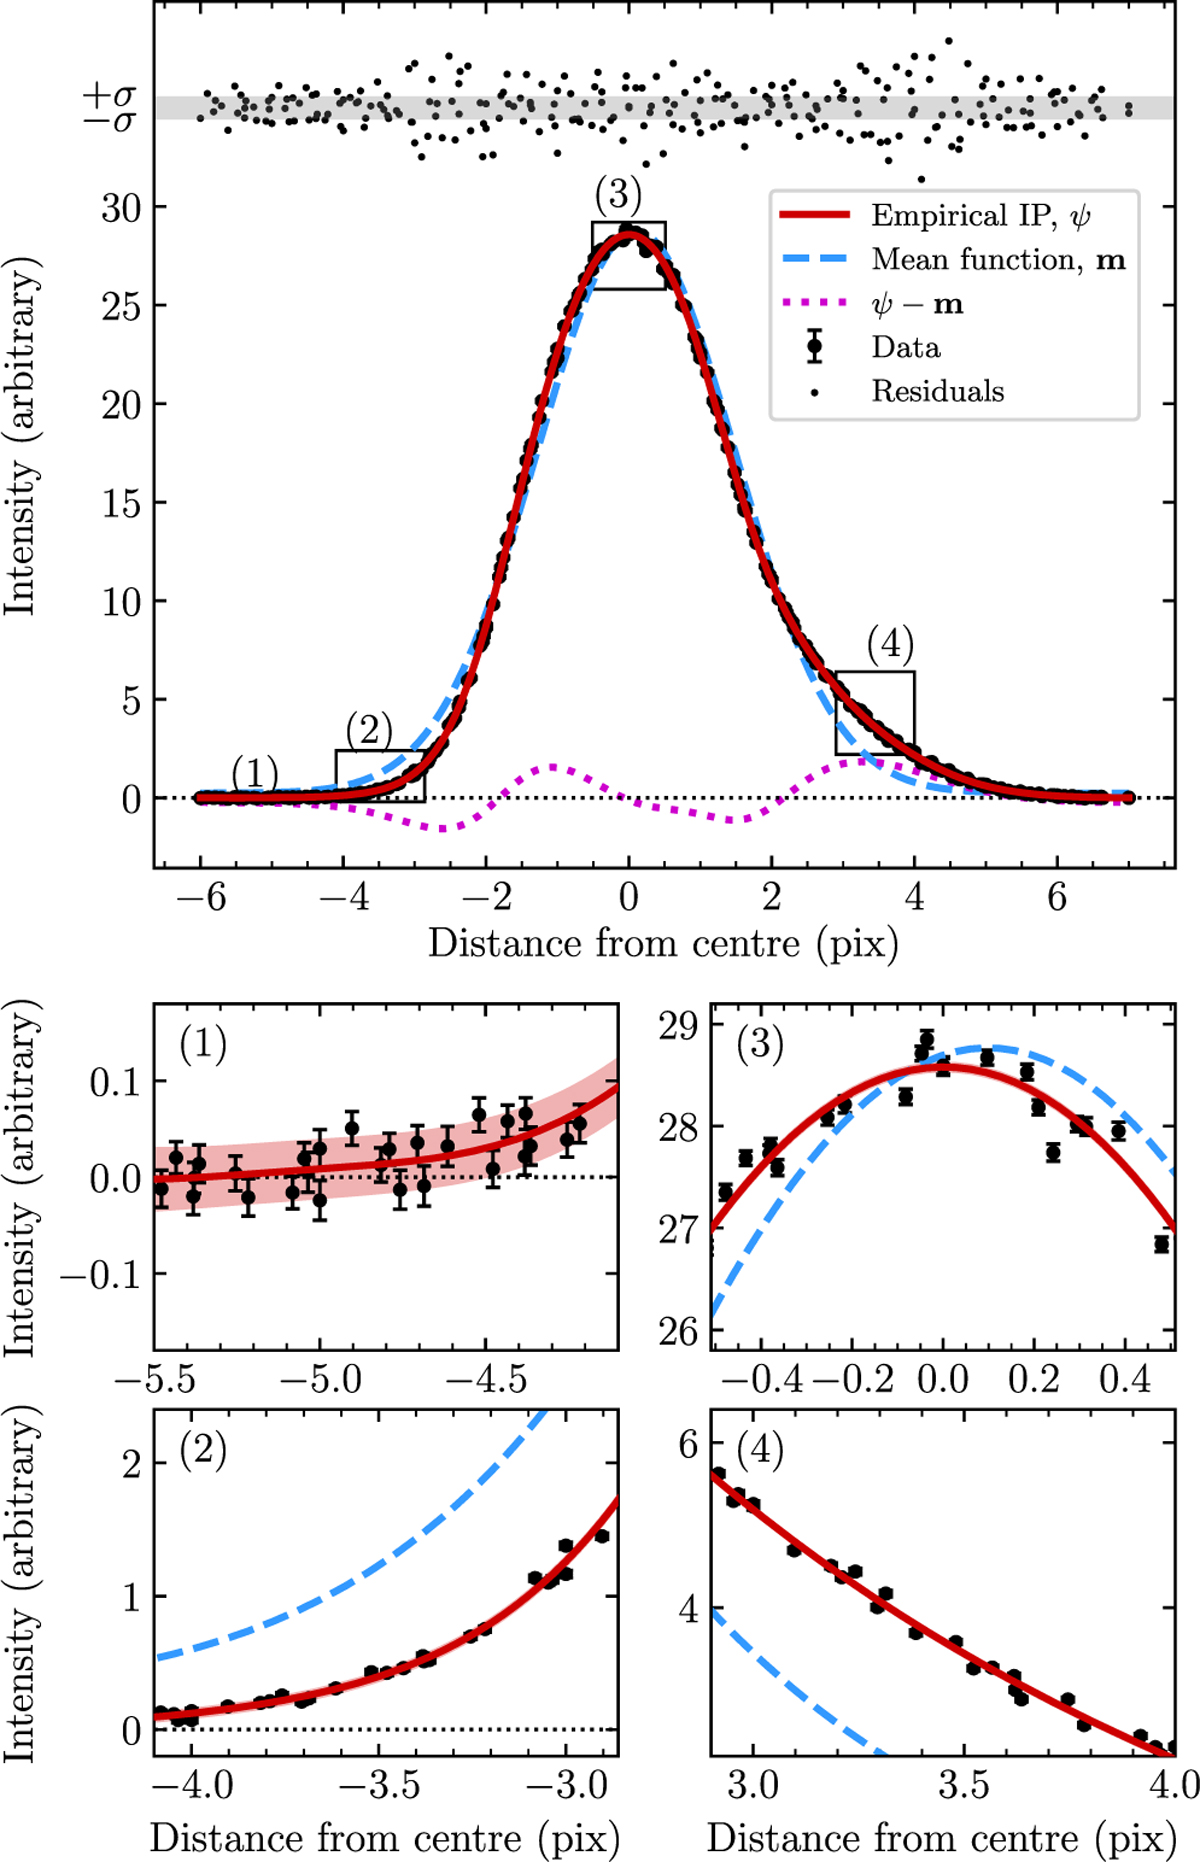
GP fits to the IP. Top panel: the large black points are the 251 ![]() samples with corresponding error bars in the first segment of order 90 (average wavelength λ = 676.5 nm), also indicated as a rectangle in Fig. 3. The thick red line is our reconstruction of ψ using GP regression (Sect. 2.4) after re-centring, in the first iteration. The secondary GP for variance estimation was not used, resulting in a
samples with corresponding error bars in the first segment of order 90 (average wavelength λ = 676.5 nm), also indicated as a rectangle in Fig. 3. The thick red line is our reconstruction of ψ using GP regression (Sect. 2.4) after re-centring, in the first iteration. The secondary GP for variance estimation was not used, resulting in a ![]() for this fit. The shaded red bands show the 1σ ranges of the model. The dashed blue line is the mean function of the GP, m(x; θ), Eq. (17). The small black points above the model show the residuals normalised with respect to the error on the data, with the grey shaded region indicating ±1σ. Parameters θ (controlling m) and ψ (controlling the correlation matrix Kij, Eq. (18)) were fitted simultaneously. The magenta dotted line is the difference between the GP model and the mean function, that is the function controlled by Kij,·. Departures from the Gaussian shape are observed almost everywhere. The thin dotted black line indicates zero flux. Rectangles indicate regions plotted in the bottom panels. Panels with numbers (1)–(4): zoom-ins of the top panel. The number in the top left corner identifies one rectangle in the top panel.
for this fit. The shaded red bands show the 1σ ranges of the model. The dashed blue line is the mean function of the GP, m(x; θ), Eq. (17). The small black points above the model show the residuals normalised with respect to the error on the data, with the grey shaded region indicating ±1σ. Parameters θ (controlling m) and ψ (controlling the correlation matrix Kij, Eq. (18)) were fitted simultaneously. The magenta dotted line is the difference between the GP model and the mean function, that is the function controlled by Kij,·. Departures from the Gaussian shape are observed almost everywhere. The thin dotted black line indicates zero flux. Rectangles indicate regions plotted in the bottom panels. Panels with numbers (1)–(4): zoom-ins of the top panel. The number in the top left corner identifies one rectangle in the top panel.
Current usage metrics show cumulative count of Article Views (full-text article views including HTML views, PDF and ePub downloads, according to the available data) and Abstracts Views on Vision4Press platform.
Data correspond to usage on the plateform after 2015. The current usage metrics is available 48-96 hours after online publication and is updated daily on week days.
Initial download of the metrics may take a while.